
|
Poco Holding Co., Ltd. (300811.SZ) Avaliação DCF |
Totalmente Editável: Adapte-Se Às Suas Necessidades No Excel Ou Planilhas
Design Profissional: Modelos Confiáveis E Padrão Da Indústria
Pré-Construídos Para Uso Rápido E Eficiente
Compatível com MAC/PC, totalmente desbloqueado
Não É Necessária Experiência; Fácil De Seguir
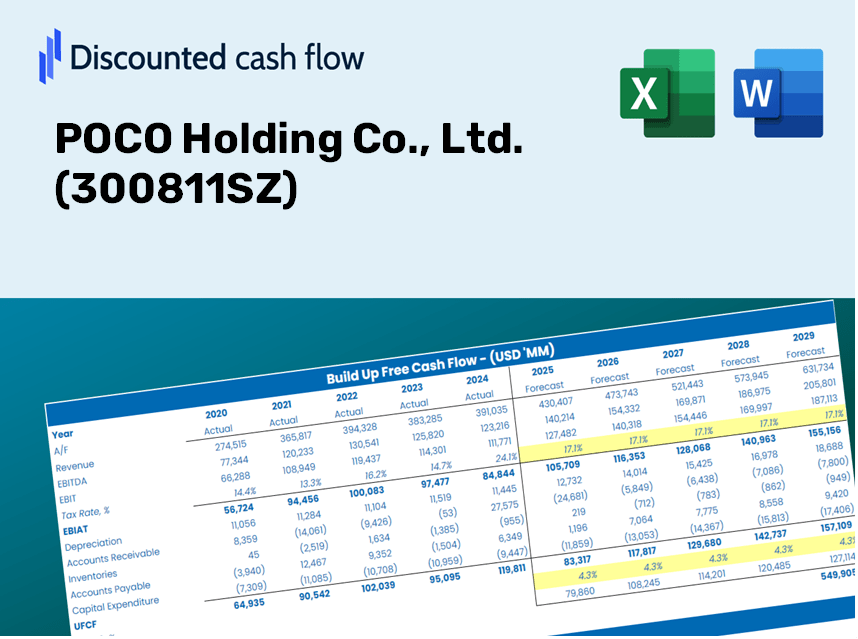
POCO Holding Co., Ltd. (300811.SZ) Bundle
Descubra o verdadeiro potencial da Poco Holding Co., Ltd. (300811SZ) com nossa calculadora DCF avançada! Ajuste as principais suposições, explore vários cenários e avalie como as alterações afetam a avaliação da Poco Holding Co., Ltd. (300811SZ) - tudo dentro de um modelo conveniente do Excel.
Discounted Cash Flow (DCF) - (USD MM)
| Year | AY1 2020 |
AY2 2021 |
AY3 2022 |
AY4 2023 |
AY5 2024 |
FY1 2025 |
FY2 2026 |
FY3 2027 |
FY4 2028 |
FY5 2029 |
|---|---|---|---|---|---|---|---|---|---|---|
| Revenue | 496.8 | 725.9 | 1,065.7 | 1,158.5 | 1,662.9 | 2,266.5 | 3,089.0 | 4,210.0 | 5,737.9 | 7,820.4 |
| Revenue Growth, % | 0 | 46.11 | 46.81 | 8.71 | 43.54 | 36.29 | 36.29 | 36.29 | 36.29 | 36.29 |
| EBITDA | 141.7 | 168.5 | 273.1 | 346.2 | 503.5 | 623.4 | 849.7 | 1,158.1 | 1,578.4 | 2,151.2 |
| EBITDA, % | 28.53 | 23.21 | 25.63 | 29.88 | 30.28 | 27.51 | 27.51 | 27.51 | 27.51 | 27.51 |
| Depreciation | 23.0 | 28.8 | 40.3 | 59.1 | 80.5 | 101.2 | 137.9 | 187.9 | 256.1 | 349.0 |
| Depreciation, % | 4.64 | 3.96 | 3.78 | 5.1 | 4.84 | 4.46 | 4.46 | 4.46 | 4.46 | 4.46 |
| EBIT | 118.7 | 139.7 | 232.9 | 287.1 | 423.0 | 522.3 | 711.8 | 970.2 | 1,322.3 | 1,802.1 |
| EBIT, % | 23.89 | 19.25 | 21.85 | 24.79 | 25.44 | 23.04 | 23.04 | 23.04 | 23.04 | 23.04 |
| Total Cash | 358.7 | 157.9 | 354.9 | 284.1 | 185.6 | 738.6 | 1,006.7 | 1,372.0 | 1,869.9 | 2,548.6 |
| Total Cash, percent | .0 | .0 | .0 | .0 | .0 | .0 | .0 | .0 | .0 | .0 |
| Account Receivables | 296.0 | 404.3 | 653.5 | 630.5 | 975.8 | 1,313.2 | 1,789.8 | 2,439.3 | 3,324.6 | 4,531.2 |
| Account Receivables, % | 59.57 | 55.7 | 61.32 | 54.43 | 58.68 | 57.94 | 57.94 | 57.94 | 57.94 | 57.94 |
| Inventories | 65.3 | 117.5 | 144.2 | 217.8 | 190.9 | 331.6 | 451.9 | 615.9 | 839.4 | 1,144.0 |
| Inventories, % | 13.14 | 16.19 | 13.53 | 18.8 | 11.48 | 14.63 | 14.63 | 14.63 | 14.63 | 14.63 |
| Accounts Payable | 64.9 | 78.2 | 162.6 | 131.2 | 111.0 | 258.8 | 352.7 | 480.7 | 655.1 | 892.9 |
| Accounts Payable, % | 13.07 | 10.77 | 15.26 | 11.32 | 6.67 | 11.42 | 11.42 | 11.42 | 11.42 | 11.42 |
| Capital Expenditure | -81.5 | -113.1 | -285.0 | -177.7 | -179.5 | -384.6 | -524.2 | -714.4 | -973.7 | -1,327.1 |
| Capital Expenditure, % | -16.4 | -15.58 | -26.74 | -15.33 | -10.79 | -16.97 | -16.97 | -16.97 | -16.97 | -16.97 |
| Tax Rate, % | 10.63 | 10.63 | 10.63 | 10.63 | 10.63 | 10.63 | 10.63 | 10.63 | 10.63 | 10.63 |
| EBITAT | 101.8 | 123.0 | 210.7 | 252.6 | 378.0 | 461.3 | 628.7 | 856.9 | 1,167.8 | 1,591.7 |
| Depreciation | ||||||||||
| Changes in Account Receivables | ||||||||||
| Changes in Inventories | ||||||||||
| Changes in Accounts Payable | ||||||||||
| Capital Expenditure | ||||||||||
| UFCF | -253.1 | -108.6 | -225.4 | 51.9 | -59.5 | -152.4 | -260.6 | -355.2 | -484.1 | -659.8 |
| WACC, % | 4.62 | 4.63 | 4.63 | 4.63 | 4.63 | 4.63 | 4.63 | 4.63 | 4.63 | 4.63 |
| PV UFCF | ||||||||||
| SUM PV UFCF | -1,624.2 | |||||||||
| Long Term Growth Rate, % | 4.00 | |||||||||
| Free cash flow (T + 1) | -686 | |||||||||
| Terminal Value | -109,533 | |||||||||
| Present Terminal Value | -87,365 | |||||||||
| Enterprise Value | -88,989 | |||||||||
| Net Debt | 304 | |||||||||
| Equity Value | -89,294 | |||||||||
| Diluted Shares Outstanding, MM | 280 | |||||||||
| Equity Value Per Share | -318.46 |
What You Will Receive
- Genuine POCO Data: Preloaded financial metrics – including revenue and EBIT – derived from actual and projected statistics.
- Complete Customization: Modify all essential parameters (yellow cells) such as WACC, growth %, and tax rates.
- Real-Time Valuation Updates: Automatic recalibrations to assess the effects of changes on POCO's fair value.
- Flexible Excel Template: Designed for quick modifications, scenario analysis, and comprehensive forecasts.
- Efficient and Accurate: Eliminate the need to create models from the ground up while ensuring accuracy and adaptability.
Key Features
- Accurate Financial Data: Gain access to reliable pre-loaded historical figures and future forecasts for POCO Holding Co., Ltd. (300811SZ).
- Adjustable Forecast Inputs: Modify the yellow-highlighted fields, including WACC, growth rates, and profit margins.
- Automated Calculations: Enjoy real-time updates for DCF, Net Present Value (NPV), and cash flow assessments.
- User-Friendly Dashboard: Clear and concise charts and summaries to help you visualize your valuation outcomes.
- Suitable for All Users: Designed with a straightforward, intuitive layout for investors, CFOs, and consultants alike.
How It Operates
- Download: Obtain the pre-structured Excel file featuring POCO Holding Co., Ltd.'s (300811SZ) financial data.
- Customize: Modify projections such as revenue growth, EBITDA %, and WACC to fit your analysis.
- Update Instantly: Real-time adjustments to intrinsic value and NPV calculations ensure accuracy.
- Explore Scenarios: Develop various projections and quickly assess different outcomes.
- Make Informed Choices: Leverage the valuation results to shape your investment approach.
Why Opt for the POCO Holding Co., Ltd. ([300811SZ]) Calculator?
- Precision: Utilizes accurate financial data from POCO Holding Co., Ltd. to ensure reliable results.
- Versatility: Built for users to easily experiment with and adjust inputs as needed.
- Efficiency: Avoid the complexities of constructing a DCF model from the ground up.
- Professional Quality: Engineered with the meticulousness and ease-of-use that CFOs expect.
- Intuitive Design: Simple to navigate, making it accessible for individuals without advanced financial modeling skills.
Who Can Benefit from POCO Holding Co., Ltd. (300811SZ) Products?
- Investors: Gain insights and make informed decisions with our advanced valuation tools.
- Financial Analysts: Enhance efficiency with our customizable DCF model designed for your needs.
- Consultants: Seamlessly modify our templates for impactful client presentations and reports.
- Finance Enthusiasts: Expand your knowledge of valuation strategies through practical, real-world applications.
- Educators and Students: Utilize our resources as effective learning aids in finance-related studies.
Contents of the Template
- Historical Data: Provides POCO Holding Co., Ltd.'s past financials and baseline forecasts.
- DCF and Levered DCF Models: Comprehensive templates for assessing the intrinsic value of POCO Holding Co., Ltd. (300811SZ).
- WACC Sheet: Ready-to-use calculations for Weighted Average Cost of Capital.
- Editable Inputs: Customize essential drivers such as growth rates, EBITDA %, and CAPEX assumptions.
- Quarterly and Annual Statements: Detailed analysis of POCO Holding Co., Ltd.'s financial performance.
- Interactive Dashboard: Dynamic visualization of valuation outcomes and projections.
Disclaimer
All information, articles, and product details provided on this website are for general informational and educational purposes only. We do not claim any ownership over, nor do we intend to infringe upon, any trademarks, copyrights, logos, brand names, or other intellectual property mentioned or depicted on this site. Such intellectual property remains the property of its respective owners, and any references here are made solely for identification or informational purposes, without implying any affiliation, endorsement, or partnership.
We make no representations or warranties, express or implied, regarding the accuracy, completeness, or suitability of any content or products presented. Nothing on this website should be construed as legal, tax, investment, financial, medical, or other professional advice. In addition, no part of this site—including articles or product references—constitutes a solicitation, recommendation, endorsement, advertisement, or offer to buy or sell any securities, franchises, or other financial instruments, particularly in jurisdictions where such activity would be unlawful.
All content is of a general nature and may not address the specific circumstances of any individual or entity. It is not a substitute for professional advice or services. Any actions you take based on the information provided here are strictly at your own risk. You accept full responsibility for any decisions or outcomes arising from your use of this website and agree to release us from any liability in connection with your use of, or reliance upon, the content or products found herein.