
|
SHANDONG DONGYUE ORGANOSILICON MATERIAIS CO., LTD. (300821.SZ) Avaliação DCF |
Totalmente Editável: Adapte-Se Às Suas Necessidades No Excel Ou Planilhas
Design Profissional: Modelos Confiáveis E Padrão Da Indústria
Pré-Construídos Para Uso Rápido E Eficiente
Compatível com MAC/PC, totalmente desbloqueado
Não É Necessária Experiência; Fácil De Seguir
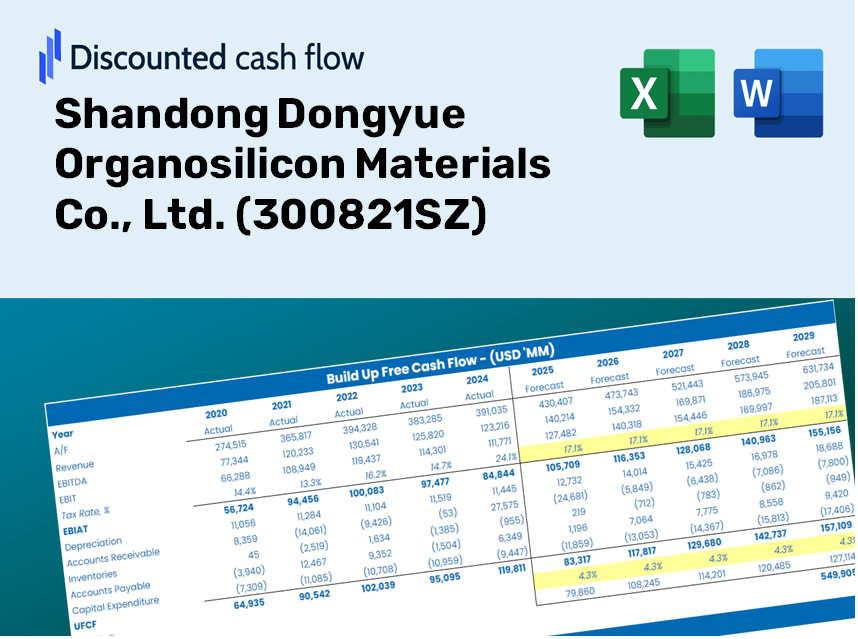
Shandong Dongyue Organosilicon Materials Co., Ltd. (300821.SZ) Bundle
Avalie a Shandong Dongyue Organosilicon Materials Co., Ltd. As perspectivas financeiras da Ltd. como um especialista! Esta calculadora DCF (300821SZ) fornece dados financeiros pré-preenchidos e flexibilidade completa para modificar o crescimento da receita, WACC, margens e outras suposições críticas com base em suas projeções.
Discounted Cash Flow (DCF) - (USD MM)
| Year | AY1 2020 |
AY2 2021 |
AY3 2022 |
AY4 2023 |
AY5 2024 |
FY1 2025 |
FY2 2026 |
FY3 2027 |
FY4 2028 |
FY5 2029 |
|---|---|---|---|---|---|---|---|---|---|---|
| Revenue | 2,503.3 | 4,333.2 | 6,734.0 | 4,801.5 | 5,150.6 | 6,529.4 | 8,277.3 | 10,493.1 | 13,302.0 | 16,862.9 |
| Revenue Growth, % | 0 | 73.1 | 55.4 | -28.7 | 7.27 | 26.77 | 26.77 | 26.77 | 26.77 | 26.77 |
| EBITDA | 375.2 | 1,406.1 | 755.4 | 14.1 | 446.6 | 883.1 | 1,119.4 | 1,419.1 | 1,799.0 | 2,280.6 |
| EBITDA, % | 14.99 | 32.45 | 11.22 | 0.29329 | 8.67 | 13.52 | 13.52 | 13.52 | 13.52 | 13.52 |
| Depreciation | 120.6 | 117.3 | 264.3 | 329.7 | 355.4 | 329.3 | 417.4 | 529.1 | 670.8 | 850.4 |
| Depreciation, % | 4.82 | 2.71 | 3.92 | 6.87 | 6.9 | 5.04 | 5.04 | 5.04 | 5.04 | 5.04 |
| EBIT | 254.7 | 1,288.8 | 491.1 | -315.6 | 91.2 | 553.8 | 702.0 | 890.0 | 1,128.2 | 1,430.2 |
| EBIT, % | 10.17 | 29.74 | 7.29 | -6.57 | 1.77 | 8.48 | 8.48 | 8.48 | 8.48 | 8.48 |
| Total Cash | 2,704.2 | 1,960.6 | 1,084.0 | 587.3 | 795.4 | 2,468.4 | 3,129.2 | 3,966.8 | 5,028.7 | 6,374.9 |
| Total Cash, percent | .0 | .0 | .0 | .0 | .0 | .0 | .0 | .0 | .0 | .0 |
| Account Receivables | 229.5 | 664.8 | 1,899.6 | 1,277.8 | 1,374.6 | 1,384.5 | 1,755.1 | 2,225.0 | 2,820.6 | 3,575.6 |
| Account Receivables, % | 9.17 | 15.34 | 28.21 | 26.61 | 26.69 | 21.2 | 21.2 | 21.2 | 21.2 | 21.2 |
| Inventories | 183.2 | 463.1 | 440.5 | 469.9 | 418.8 | 554.5 | 702.9 | 891.1 | 1,129.7 | 1,432.1 |
| Inventories, % | 7.32 | 10.69 | 6.54 | 9.79 | 8.13 | 8.49 | 8.49 | 8.49 | 8.49 | 8.49 |
| Accounts Payable | 324.5 | 893.9 | 711.6 | 581.6 | 447.5 | 848.3 | 1,075.4 | 1,363.3 | 1,728.3 | 2,190.9 |
| Accounts Payable, % | 12.96 | 20.63 | 10.57 | 12.11 | 8.69 | 12.99 | 12.99 | 12.99 | 12.99 | 12.99 |
| Capital Expenditure | -170.1 | -1,122.9 | -573.3 | -233.6 | -16.7 | -606.1 | -768.4 | -974.1 | -1,234.8 | -1,565.4 |
| Capital Expenditure, % | -6.8 | -25.91 | -8.51 | -4.87 | -0.32478 | -9.28 | -9.28 | -9.28 | -9.28 | -9.28 |
| Tax Rate, % | 22.12 | 22.12 | 22.12 | 22.12 | 22.12 | 22.12 | 22.12 | 22.12 | 22.12 | 22.12 |
| EBITAT | 233.7 | 1,128.0 | 463.2 | -286.2 | 71.1 | 489.7 | 620.8 | 787.0 | 997.7 | 1,264.8 |
| Depreciation | ||||||||||
| Changes in Account Receivables | ||||||||||
| Changes in Inventories | ||||||||||
| Changes in Accounts Payable | ||||||||||
| Capital Expenditure | ||||||||||
| UFCF | 96.0 | -23.5 | -1,240.4 | 272.2 | 230.0 | 468.0 | -22.1 | -28.0 | -35.6 | -45.1 |
| WACC, % | 7.4 | 7.4 | 7.4 | 7.4 | 7.4 | 7.4 | 7.4 | 7.4 | 7.4 | 7.4 |
| PV UFCF | ||||||||||
| SUM PV UFCF | 335.7 | |||||||||
| Long Term Growth Rate, % | 2.00 | |||||||||
| Free cash flow (T + 1) | -46 | |||||||||
| Terminal Value | -851 | |||||||||
| Present Terminal Value | -595 | |||||||||
| Enterprise Value | -260 | |||||||||
| Net Debt | -795 | |||||||||
| Equity Value | 536 | |||||||||
| Diluted Shares Outstanding, MM | 1,135 | |||||||||
| Equity Value Per Share | 0.47 |
What You Will Receive
- Genuine 300821SZ Financial Data: Pre-loaded with Shandong Dongyue Organosilicon's historical and projected figures for accurate analysis.
- Completely Customizable Template: Easily adjust key variables such as revenue growth, WACC, and EBITDA margin.
- Instant Calculations: Watch the intrinsic value of Shandong Dongyue Organosilicon update in real-time as you make modifications.
- Expert Valuation Tool: Tailored for investors, analysts, and consultants in search of precise DCF outcomes.
- Intuitive Design: Clear layout and straightforward instructions suitable for all skill levels.
Key Features
- 🔍 Real-Life 300821SZ Financials: Access pre-filled historical and projected data for Shandong Dongyue Organosilicon Materials Co., Ltd.
- ✏️ Fully Customizable Inputs: Modify all essential parameters (yellow cells) such as WACC, growth %, and tax rates according to your needs.
- 📊 Professional DCF Valuation: Utilize built-in formulas to calculate the intrinsic value of Shandong Dongyue using the Discounted Cash Flow method.
- ⚡ Instant Results: Visualize the company's valuation immediately after making adjustments.
- Scenario Analysis: Evaluate and compare the outcomes of different financial assumptions side-by-side.
Process Overview
- 1. Access the Template: Download and launch the Excel file containing Shandong Dongyue Organosilicon Materials Co., Ltd.'s preloaded data.
- 2. Modify Key Inputs: Adjust critical parameters such as growth projections, WACC, and capital expenditures.
- 3. Analyze Results Immediately: The DCF model automatically computes intrinsic value and NPV in real-time.
- 4. Experiment with Scenarios: Evaluate multiple forecasts to investigate various valuation results.
- 5. Present with Assurance: Deliver expert valuation insights to back up your strategic decisions for Shandong Dongyue Organosilicon Materials Co., Ltd. (300821SZ).
Why Choose This Calculator for Shandong Dongyue Organosilicon Materials Co., Ltd. (300821SZ)?
- Tailored for Industry Experts: A sophisticated tool utilized by analysts, CFOs, and consultants in the organosilicon sector.
- Reliable Data: Historical and projected financial information for Shandong Dongyue integrated for precision.
- Flexible Scenario Analysis: Effortlessly model various forecasts and assumptions.
- Transparent Results: Automatically computes intrinsic value, NPV, and essential financial metrics.
- User-Friendly: Comprehensive step-by-step guidance simplifies the calculation process.
Who Should Use This Product?
- Investors: Accurately assess the fair value of Shandong Dongyue Organosilicon Materials Co., Ltd. (300821SZ) before making investment choices.
- CFOs: Utilize a professional-grade DCF model for comprehensive financial reporting and analysis related to Shandong Dongyue Organosilicon Materials Co., Ltd. (300821SZ).
- Consultants: Efficiently customize the template for valuation reports tailored to clients interested in Shandong Dongyue Organosilicon Materials Co., Ltd. (300821SZ).
- Entrepreneurs: Acquire insights into financial modeling practices utilized by leading firms in the organosilicon industry, like Shandong Dongyue Organosilicon Materials Co., Ltd. (300821SZ).
- Educators: Employ this tool as a resource to illustrate valuation techniques and methodologies in the context of Shandong Dongyue Organosilicon Materials Co., Ltd. (300821SZ).
Contents of the Template
- Pre-Filled DCF Model: Shandong Dongyue Organosilicon Materials Co., Ltd.'s financial data preloaded for immediate application.
- WACC Calculator: Comprehensive calculations for the Weighted Average Cost of Capital.
- Financial Ratios: Assess Shandong Dongyue's profitability, leverage, and operational efficiency.
- Editable Inputs: Modify assumptions such as growth rates, margins, and CAPEX to align with your scenarios.
- Financial Statements: Annual and quarterly reports provided for thorough analysis.
- Interactive Dashboard: Conveniently visualize essential valuation metrics and outcomes.
Disclaimer
All information, articles, and product details provided on this website are for general informational and educational purposes only. We do not claim any ownership over, nor do we intend to infringe upon, any trademarks, copyrights, logos, brand names, or other intellectual property mentioned or depicted on this site. Such intellectual property remains the property of its respective owners, and any references here are made solely for identification or informational purposes, without implying any affiliation, endorsement, or partnership.
We make no representations or warranties, express or implied, regarding the accuracy, completeness, or suitability of any content or products presented. Nothing on this website should be construed as legal, tax, investment, financial, medical, or other professional advice. In addition, no part of this site—including articles or product references—constitutes a solicitation, recommendation, endorsement, advertisement, or offer to buy or sell any securities, franchises, or other financial instruments, particularly in jurisdictions where such activity would be unlawful.
All content is of a general nature and may not address the specific circumstances of any individual or entity. It is not a substitute for professional advice or services. Any actions you take based on the information provided here are strictly at your own risk. You accept full responsibility for any decisions or outcomes arising from your use of this website and agree to release us from any liability in connection with your use of, or reliance upon, the content or products found herein.