
|
Chengdu Kanghua Biological Products Co., Ltd. (300841.sz) Avaliação DCF |
Totalmente Editável: Adapte-Se Às Suas Necessidades No Excel Ou Planilhas
Design Profissional: Modelos Confiáveis E Padrão Da Indústria
Pré-Construídos Para Uso Rápido E Eficiente
Compatível com MAC/PC, totalmente desbloqueado
Não É Necessária Experiência; Fácil De Seguir
Chengdu Kanghua Biological Products Co., Ltd. (300841.SZ) Bundle
Aprimore suas estratégias de investimento com a calculadora DCF (300841SZ)! Utilize dados financeiros reais da Chengdu Kanghua Biological Products Co., Ltd., ajuste as projeções e despesas de crescimento e observe instantaneamente como essas mudanças afetam o valor intrínseco da empresa.
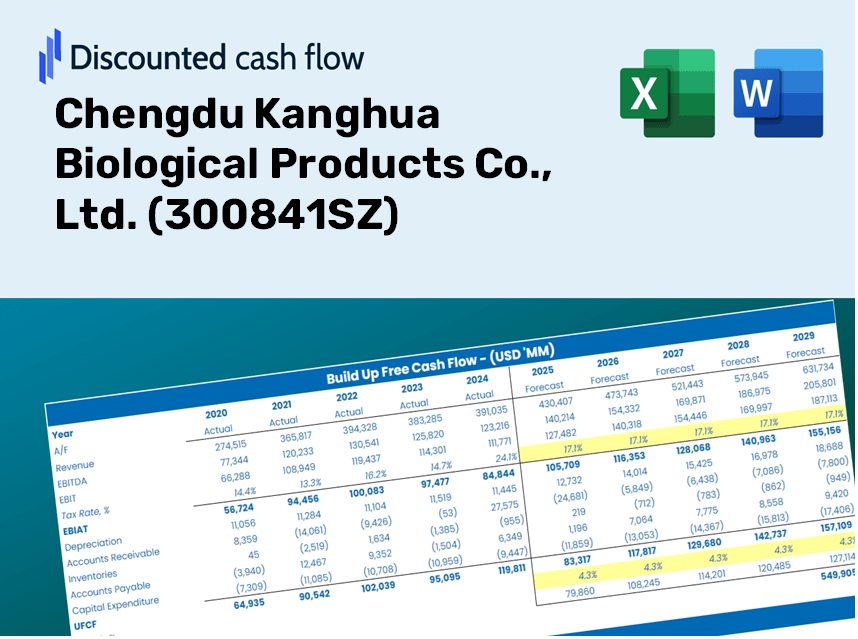
Discounted Cash Flow (DCF) - (USD MM)
| Year | AY1 2020 |
AY2 2021 |
AY3 2022 |
AY4 2023 |
AY5 2024 |
FY1 2025 |
FY2 2026 |
FY3 2027 |
FY4 2028 |
FY5 2029 |
|---|---|---|---|---|---|---|---|---|---|---|
| Revenue | 1,038.6 | 1,292.4 | 1,446.7 | 1,577.4 | 1,431.9 | 1,561.4 | 1,702.6 | 1,856.6 | 2,024.6 | 2,207.7 |
| Revenue Growth, % | 0 | 24.44 | 11.94 | 9.03 | -9.23 | 9.05 | 9.05 | 9.05 | 9.05 | 9.05 |
| EBITDA | 478.2 | 629.0 | 643.4 | 651.5 | 595.0 | 693.4 | 756.1 | 824.5 | 899.1 | 980.4 |
| EBITDA, % | 46.04 | 48.67 | 44.47 | 41.3 | 41.56 | 44.41 | 44.41 | 44.41 | 44.41 | 44.41 |
| Depreciation | 12.3 | 15.0 | 31.5 | 51.0 | 63.4 | 38.1 | 41.5 | 45.2 | 49.3 | 53.8 |
| Depreciation, % | 1.18 | 1.16 | 2.18 | 3.23 | 4.43 | 2.44 | 2.44 | 2.44 | 2.44 | 2.44 |
| EBIT | 465.9 | 614.0 | 611.8 | 600.5 | 531.6 | 655.3 | 714.6 | 779.2 | 849.7 | 926.6 |
| EBIT, % | 44.86 | 47.5 | 42.29 | 38.07 | 37.13 | 41.97 | 41.97 | 41.97 | 41.97 | 41.97 |
| Total Cash | 1,325.5 | 926.9 | 651.5 | 1,039.4 | 1,001.3 | 1,101.0 | 1,200.6 | 1,309.2 | 1,427.6 | 1,556.7 |
| Total Cash, percent | .0 | .0 | .0 | .0 | .0 | .0 | .0 | .0 | .0 | .0 |
| Account Receivables | 352.7 | 839.8 | 1,304.8 | 1,410.5 | 1,299.7 | 1,153.3 | 1,257.6 | 1,371.3 | 1,495.4 | 1,630.6 |
| Account Receivables, % | 33.96 | 64.97 | 90.19 | 89.42 | 90.77 | 73.86 | 73.86 | 73.86 | 73.86 | 73.86 |
| Inventories | 49.9 | 105.5 | 153.6 | 173.5 | 176.9 | 146.6 | 159.9 | 174.3 | 190.1 | 207.3 |
| Inventories, % | 4.81 | 8.16 | 10.62 | 11 | 12.35 | 9.39 | 9.39 | 9.39 | 9.39 | 9.39 |
| Accounts Payable | 5.9 | 6.1 | 34.1 | 7.1 | 5.9 | 13.3 | 14.5 | 15.8 | 17.2 | 18.8 |
| Accounts Payable, % | 0.56449 | 0.46875 | 2.36 | 0.45196 | 0.41228 | 0.8515 | 0.8515 | 0.8515 | 0.8515 | 0.8515 |
| Capital Expenditure | -135.7 | -314.9 | -419.2 | -157.3 | -144.3 | -270.0 | -294.4 | -321.0 | -350.1 | -381.7 |
| Capital Expenditure, % | -13.06 | -24.37 | -28.98 | -9.97 | -10.08 | -17.29 | -17.29 | -17.29 | -17.29 | -17.29 |
| Tax Rate, % | 14.64 | 14.64 | 14.64 | 14.64 | 14.64 | 14.64 | 14.64 | 14.64 | 14.64 | 14.64 |
| EBITAT | 392.9 | 556.2 | 535.1 | 532.7 | 453.8 | 572.0 | 623.8 | 680.2 | 741.7 | 808.8 |
| Depreciation | ||||||||||
| Changes in Account Receivables | ||||||||||
| Changes in Inventories | ||||||||||
| Changes in Accounts Payable | ||||||||||
| Capital Expenditure | ||||||||||
| UFCF | -127.3 | -286.1 | -337.7 | 273.8 | 479.2 | 524.2 | 254.5 | 277.5 | 302.6 | 330.0 |
| WACC, % | 6.55 | 6.56 | 6.56 | 6.56 | 6.55 | 6.56 | 6.56 | 6.56 | 6.56 | 6.56 |
| PV UFCF | ||||||||||
| SUM PV UFCF | 1,420.4 | |||||||||
| Long Term Growth Rate, % | 2.00 | |||||||||
| Free cash flow (T + 1) | 337 | |||||||||
| Terminal Value | 7,388 | |||||||||
| Present Terminal Value | 5,378 | |||||||||
| Enterprise Value | 6,799 | |||||||||
| Net Debt | -814 | |||||||||
| Equity Value | 7,613 | |||||||||
| Diluted Shares Outstanding, MM | 132 | |||||||||
| Equity Value Per Share | 57.83 |
What You Will Receive
- Authentic 300841SZ Financials: Access to both historical and projected data for precise valuation.
- Customizable Inputs: Tailor WACC, tax rates, revenue growth, and capital expenditures to fit your analysis.
- Automated Calculations: Dynamic computation of intrinsic value and NPV at your fingertips.
- Scenario Analysis: Evaluate various scenarios to assess the future performance of Chengdu Kanghua Biological Products.
- User-Friendly Design: Designed for professionals while remaining approachable for newcomers.
Key Features
- Comprehensive Historical Data: Access to Chengdu Kanghua Biological Products Co., Ltd.'s (300841SZ) financial records and pre-filled projections.
- Customizable Parameters: Modify WACC, tax rates, revenue growth, and EBITDA margins as needed.
- Real-Time Calculations: Watch the intrinsic value of Chengdu Kanghua Biological Products Co., Ltd. (300841SZ) update instantly.
- Intuitive Visual Representation: Well-designed dashboard charts present valuation outcomes and essential metrics.
- Engineered for Precision: A professional-grade tool tailored for analysts, investors, and finance professionals.
How It Operates
- Step 1: Download the preconfigured Excel template featuring data on Chengdu Kanghua Biological Products Co., Ltd. (300841SZ).
- Step 2: Review the filled-in sheets to familiarize yourself with the essential metrics.
- Step 3: Adjust the forecasts and assumptions in the editable yellow cells (WACC, growth, margins).
- Step 4: Instantly see the recalibrated results, including the intrinsic value of Chengdu Kanghua Biological Products Co., Ltd. (300841SZ).
- Step 5: Utilize the outputs to make informed investment decisions or create detailed reports.
Why Opt for Chengdu Kanghua Biological Products Co., Ltd. (300841SZ)?
- All-in-One Solution: Combines comprehensive data analysis including DCF, WACC, and vital financial ratios.
- Flexible Input Options: Modify the highlighted cells to explore diverse scenarios tailored to your needs.
- In-Depth Analysis: Automatically computes intrinsic value and Net Present Value for informed decision-making.
- Comprehensive Data Integration: Features both historical and forecasted data for reliable benchmarks.
- Expert-Level Quality: Perfectly suited for financial analysts, investors, and business consultants seeking valuable insights.
Who Can Benefit from This Product?
- Investors: Evaluate the valuation of Chengdu Kanghua Biological Products Co., Ltd. (300841SZ) before making investment decisions.
- CFOs and Financial Analysts: Optimize valuation assessments and analyze financial forecasts.
- Startup Founders: Understand valuation methodologies used by leading companies like Chengdu Kanghua Biological Products Co., Ltd. (300841SZ).
- Consultants: Provide detailed valuation reports to clients based on industry standards.
- Students and Educators: Utilize actual market data to practice and instruct on valuation strategies.
Contents of the Template
- Preloaded Kanghua Data: Historical and projected financial information, including revenue, EBIT, and capital expenditures for Chengdu Kanghua Biological Products Co., Ltd. (300841SZ).
- DCF and WACC Models: Premium spreadsheets designed for calculating intrinsic value and Weighted Average Cost of Capital for the company.
- Editable Inputs: Cells highlighted in yellow to allow modifications for revenue growth, tax rates, and discount rates.
- Financial Statements: Detailed annual and quarterly financials for thorough analysis of performance.
- Key Ratios: Metrics for profitability, leverage, and efficiency to assess company performance.
- Dashboard and Charts: Visual representations summarizing valuation results and underlying assumptions.
Disclaimer
All information, articles, and product details provided on this website are for general informational and educational purposes only. We do not claim any ownership over, nor do we intend to infringe upon, any trademarks, copyrights, logos, brand names, or other intellectual property mentioned or depicted on this site. Such intellectual property remains the property of its respective owners, and any references here are made solely for identification or informational purposes, without implying any affiliation, endorsement, or partnership.
We make no representations or warranties, express or implied, regarding the accuracy, completeness, or suitability of any content or products presented. Nothing on this website should be construed as legal, tax, investment, financial, medical, or other professional advice. In addition, no part of this site—including articles or product references—constitutes a solicitation, recommendation, endorsement, advertisement, or offer to buy or sell any securities, franchises, or other financial instruments, particularly in jurisdictions where such activity would be unlawful.
All content is of a general nature and may not address the specific circumstances of any individual or entity. It is not a substitute for professional advice or services. Any actions you take based on the information provided here are strictly at your own risk. You accept full responsibility for any decisions or outcomes arising from your use of this website and agree to release us from any liability in connection with your use of, or reliance upon, the content or products found herein.