
|
Anhui Landun Photoeletron Co., Ltd. (300862.sz) Avaliação DCF |
Totalmente Editável: Adapte-Se Às Suas Necessidades No Excel Ou Planilhas
Design Profissional: Modelos Confiáveis E Padrão Da Indústria
Pré-Construídos Para Uso Rápido E Eficiente
Compatível com MAC/PC, totalmente desbloqueado
Não É Necessária Experiência; Fácil De Seguir
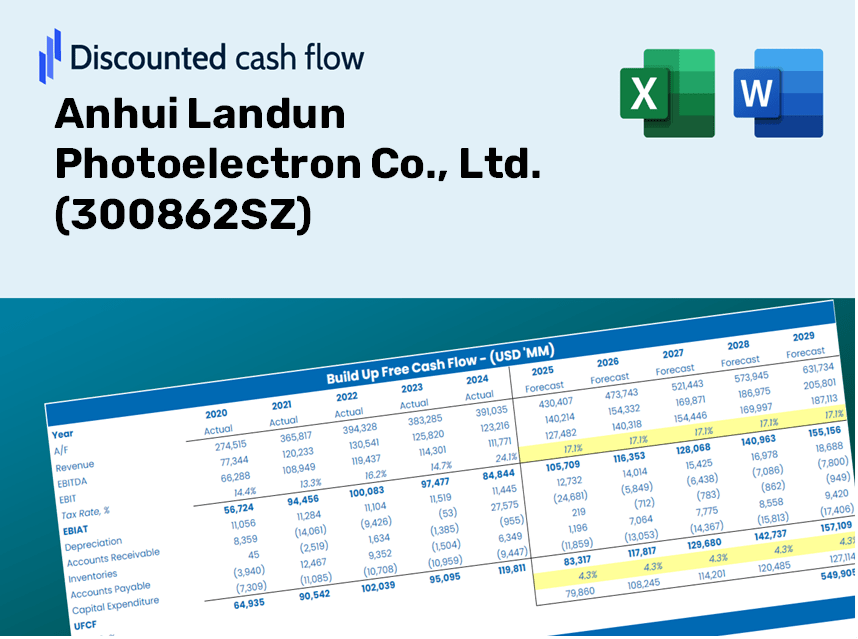
Anhui Landun Photoelectron Co., Ltd. (300862.SZ) Bundle
Descubra o verdadeiro valor da Anhui Landun Photoeletron Co., Ltd. (300862SZ) com nossa calculadora DCF avançada! Ajuste as principais suposições, explore vários cenários e avalie como as mudanças afetam a avaliação de Anhui Landun Photoeletron Co., Ltd. (300862SZ) - tudo dentro de um modelo de excel conveniente.
Benefits You Will Receive
- Authentic 300862SZ Financial Data: Access both historical and projected figures for precise valuation.
- Customizable Parameters: Adjust inputs for WACC, tax rates, revenue growth, and capital expenditures.
- Automatic Calculations: Real-time computation of intrinsic value and NPV.
- Scenario Analysis: Evaluate various scenarios to assess Anhui Landun's future performance.
- User-Friendly Design: Designed for experts while remaining easy to navigate for newcomers.
Key Features
- Accurate Financial Data for Anhui Landun: Access reliable historical performance metrics and future forecasts.
- Customizable Forecast Inputs: Modify highlighted cells for key variables such as WACC, growth rates, and profit margins.
- Real-Time Calculations: Automatic updates to DCF, Net Present Value (NPV), and cash flow reports.
- User-Friendly Dashboard: Intuitive charts and summaries for clear visualization of your valuation outcomes.
- Designed for All Skill Levels: A straightforward layout suitable for investors, CFOs, and consultants alike.
How It Works
- Download: Obtain the comprehensive Excel file containing Anhui Landun Photoelectron Co., Ltd. (300862SZ) financial data.
- Customize: Modify projections, including revenue growth, EBITDA margin, and WACC.
- Update Automatically: The calculations for intrinsic value and NPV refresh in real-time.
- Test Scenarios: Generate various forecasts and compare results immediately.
- Make Decisions: Leverage the valuation insights to inform your investment strategy.
Why Choose Anhui Landun Photoelectron Co., Ltd. (300862SZ)?
- Save Time: Eliminate the hassle of building a model from scratch—our tools are ready to use.
- Enhance Accuracy: Access reliable financial data and formulas to minimize valuation errors.
- Completely Customizable: Adjust the model to align with your specific assumptions and forecasts.
- User-Friendly: Intuitive charts and outputs facilitate easy analysis of results.
- Endorsed by Professionals: Created for experts who prioritize precision and functionality.
Who Can Benefit from This Product?
- Institutional Investors: Develop comprehensive and accurate valuation models for assessing investments in Anhui Landun Photoelectron Co., Ltd. (300862SZ).
- Corporate Financial Departments: Evaluate valuation scenarios to inform strategic planning within the organization.
- Consultants and Financial Advisors: Deliver precise valuation insights tailored to clients interested in Anhui Landun Photoelectron Co., Ltd. (300862SZ).
- Students and Instructors: Utilize real-world data for hands-on practice and education in financial modeling.
- Technology Enthusiasts: Gain insights into the market valuation of tech companies like Anhui Landun Photoelectron Co., Ltd. (300862SZ).
What the Template Contains
- Historical Data: Includes Anhui Landun Photoelectron Co., Ltd.'s past financials and baseline forecasts.
- DCF and Levered DCF Models: Detailed templates to calculate the intrinsic value of Anhui Landun Photoelectron Co., Ltd. (300862SZ).
- WACC Sheet: Pre-built calculations for Weighted Average Cost of Capital.
- Editable Inputs: Modify key drivers such as growth rates, EBITDA %, and CAPEX assumptions.
- Quarterly and Annual Statements: A complete breakdown of Anhui Landun Photoelectron Co., Ltd.'s financials.
- Interactive Dashboard: Visualize valuation results and projections dynamically.
Disclaimer
All information, articles, and product details provided on this website are for general informational and educational purposes only. We do not claim any ownership over, nor do we intend to infringe upon, any trademarks, copyrights, logos, brand names, or other intellectual property mentioned or depicted on this site. Such intellectual property remains the property of its respective owners, and any references here are made solely for identification or informational purposes, without implying any affiliation, endorsement, or partnership.
We make no representations or warranties, express or implied, regarding the accuracy, completeness, or suitability of any content or products presented. Nothing on this website should be construed as legal, tax, investment, financial, medical, or other professional advice. In addition, no part of this site—including articles or product references—constitutes a solicitation, recommendation, endorsement, advertisement, or offer to buy or sell any securities, franchises, or other financial instruments, particularly in jurisdictions where such activity would be unlawful.
All content is of a general nature and may not address the specific circumstances of any individual or entity. It is not a substitute for professional advice or services. Any actions you take based on the information provided here are strictly at your own risk. You accept full responsibility for any decisions or outcomes arising from your use of this website and agree to release us from any liability in connection with your use of, or reliance upon, the content or products found herein.