
|
Marssenger Kitchenware Co., Ltd. (300894.SZ) Avaliação DCF |
Totalmente Editável: Adapte-Se Às Suas Necessidades No Excel Ou Planilhas
Design Profissional: Modelos Confiáveis E Padrão Da Indústria
Pré-Construídos Para Uso Rápido E Eficiente
Compatível com MAC/PC, totalmente desbloqueado
Não É Necessária Experiência; Fácil De Seguir
Marssenger Kitchenware Co., Ltd. (300894.SZ) Bundle
Projetado para precisão, nossa calculadora DCF (300894SZ) permite avaliar a avaliação da Marssenger Kitchenware Co., Ltd. Usando dados financeiros abrangentes e completa flexibilidade para modificar todos os parâmetros essenciais para obter projeções aprimoradas.
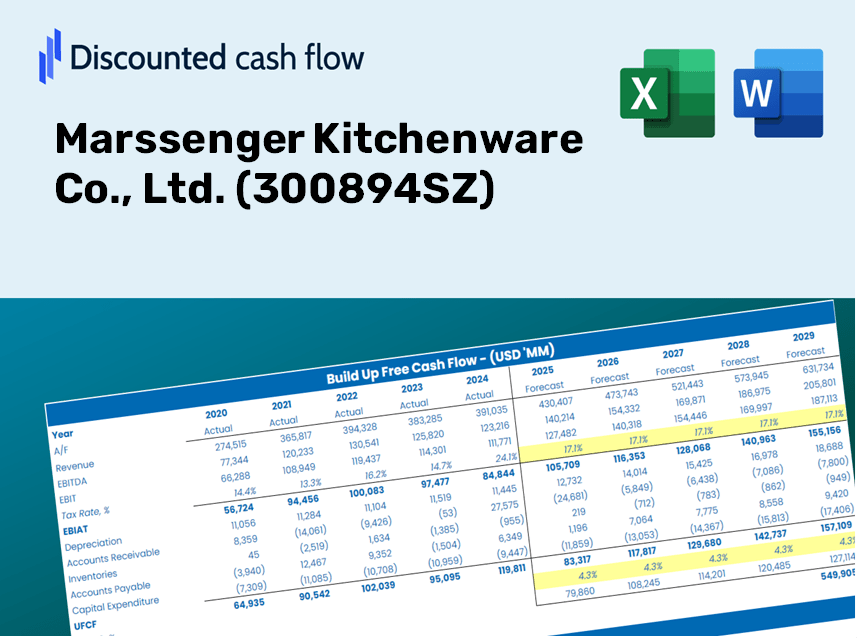
Discounted Cash Flow (DCF) - (USD MM)
| Year | AY1 2020 |
AY2 2021 |
AY3 2022 |
AY4 2023 |
AY5 2024 |
FY1 2025 |
FY2 2026 |
FY3 2027 |
FY4 2028 |
FY5 2029 |
|---|---|---|---|---|---|---|---|---|---|---|
| Revenue | 1,614.1 | 2,318.7 | 2,276.7 | 2,139.4 | 1,376.0 | 1,376.5 | 1,376.9 | 1,377.3 | 1,377.8 | 1,378.2 |
| Revenue Growth, % | 0 | 43.65 | -1.81 | -6.03 | -35.68 | 0.03175665 | 0.03175665 | 0.03175665 | 0.03175665 | 0.03175665 |
| EBITDA | 392.1 | 530.0 | 481.5 | 416.8 | 119.6 | 265.6 | 265.7 | 265.8 | 265.8 | 265.9 |
| EBITDA, % | 24.29 | 22.86 | 21.15 | 19.48 | 8.69 | 19.29 | 19.29 | 19.29 | 19.29 | 19.29 |
| Depreciation | 68.9 | 95.2 | 121.0 | 131.1 | 113.4 | 77.2 | 77.3 | 77.3 | 77.3 | 77.3 |
| Depreciation, % | 4.27 | 4.1 | 5.32 | 6.13 | 8.24 | 5.61 | 5.61 | 5.61 | 5.61 | 5.61 |
| EBIT | 323.2 | 434.9 | 360.5 | 285.7 | 6.2 | 188.3 | 188.4 | 188.5 | 188.5 | 188.6 |
| EBIT, % | 20.02 | 18.76 | 15.83 | 13.36 | 0.45075 | 13.68 | 13.68 | 13.68 | 13.68 | 13.68 |
| Total Cash | 1,112.0 | 1,191.8 | 1,761.9 | 1,760.5 | 824.0 | 935.6 | 935.9 | 936.2 | 936.5 | 936.8 |
| Total Cash, percent | .0 | .0 | .0 | .0 | .0 | .0 | .0 | .0 | .0 | .0 |
| Account Receivables | 71.8 | 75.3 | 182.8 | 188.9 | 186.7 | 104.9 | 105.0 | 105.0 | 105.0 | 105.1 |
| Account Receivables, % | 4.45 | 3.25 | 8.03 | 8.83 | 13.57 | 7.62 | 7.62 | 7.62 | 7.62 | 7.62 |
| Inventories | 210.4 | 238.7 | 272.6 | 232.7 | 160.9 | 159.3 | 159.4 | 159.4 | 159.5 | 159.5 |
| Inventories, % | 13.04 | 10.3 | 11.97 | 10.88 | 11.69 | 11.58 | 11.58 | 11.58 | 11.58 | 11.58 |
| Accounts Payable | 337.4 | 460.2 | 421.6 | 352.2 | 215.3 | 251.6 | 251.6 | 251.7 | 251.8 | 251.9 |
| Accounts Payable, % | 20.9 | 19.85 | 18.52 | 16.46 | 15.65 | 18.28 | 18.28 | 18.28 | 18.28 | 18.28 |
| Capital Expenditure | -172.2 | -179.3 | -220.9 | -195.0 | -146.2 | -131.7 | -131.7 | -131.8 | -131.8 | -131.9 |
| Capital Expenditure, % | -10.67 | -7.73 | -9.7 | -9.11 | -10.62 | -9.57 | -9.57 | -9.57 | -9.57 | -9.57 |
| Tax Rate, % | -6765.93 | -6765.93 | -6765.93 | -6765.93 | -6765.93 | -6765.93 | -6765.93 | -6765.93 | -6765.93 | -6765.93 |
| EBITAT | 277.4 | 375.8 | 323.2 | 257.6 | 425.9 | 170.3 | 170.3 | 170.4 | 170.5 | 170.5 |
| Depreciation | ||||||||||
| Changes in Account Receivables | ||||||||||
| Changes in Inventories | ||||||||||
| Changes in Accounts Payable | ||||||||||
| Capital Expenditure | ||||||||||
| UFCF | 229.3 | 382.6 | 43.3 | 158.2 | 330.2 | 235.4 | 115.9 | 115.9 | 115.9 | 116.0 |
| WACC, % | 8.55 | 8.55 | 8.56 | 8.56 | 8.6 | 8.56 | 8.56 | 8.56 | 8.56 | 8.56 |
| PV UFCF | ||||||||||
| SUM PV UFCF | 566.0 | |||||||||
| Long Term Growth Rate, % | 3.00 | |||||||||
| Free cash flow (T + 1) | 119 | |||||||||
| Terminal Value | 2,147 | |||||||||
| Present Terminal Value | 1,424 | |||||||||
| Enterprise Value | 1,990 | |||||||||
| Net Debt | -268 | |||||||||
| Equity Value | 2,257 | |||||||||
| Diluted Shares Outstanding, MM | 372 | |||||||||
| Equity Value Per Share | 6.07 |
Benefits You Will Receive
- Accurate Financial Data for Marssenger Kitchenware (300894SZ): Access historical and projected figures for precise valuation.
- Customizable Inputs: Adjust parameters such as WACC, tax rates, revenue growth, and capital expenditures.
- Real-Time Calculations: Intrinsic value and NPV are calculated automatically as data changes.
- Scenario Analysis: Explore various scenarios to assess Marssenger's future performance.
- User-Friendly Design: Designed for industry professionals yet easy enough for newcomers to navigate.
Key Features
- Authentic Financial Data: Gain access to precise historical figures and future forecasts for Marssenger Kitchenware Co., Ltd. (300894SZ).
- Adjustable Projection Assumptions: Modify the highlighted cells for key metrics such as WACC, growth rates, and profit margins.
- Automated Calculations: Real-time updates for DCF, Net Present Value (NPV), and cash flow assessments.
- User-Friendly Dashboard: Clear charts and summaries to help visualize your valuation outcomes.
- Ideal for All Skill Levels: An easy-to-navigate layout designed for investors, financial officers, and consultants alike.
How It Works
- Step 1: Download the Excel file.
- Step 2: Review the pre-filled data for Marssenger Kitchenware Co., Ltd. (300894SZ) - including historical and projected figures.
- Step 3: Modify key assumptions (yellow cells) based on your analysis.
- Step 4: Observe the automatic recalculations reflecting Marssenger’s intrinsic value.
- Step 5: Utilize the results for investment strategies or reporting purposes.
Why Choose Marssenger Kitchenware Co., Ltd. (300894SZ)?
- Precision: Accurate financial data tailored to the kitchenware industry.
- Versatility: Empowering users to experiment with various inputs effortlessly.
- Efficiency: Eliminate the complexity of creating a financial model from the ground up.
- Expert-Level: Crafted with insights from top-level industry professionals.
- Intuitive: User-friendly interface accessible to all, regardless of financial expertise.
Who Can Benefit from This Product?
- Investors: Assess the fair value of Marssenger Kitchenware Co., Ltd. (300894SZ) before making investment choices.
- CFOs: Utilize a high-quality DCF model for accurate financial reporting and analysis.
- Consultants: Easily customize the template for client valuation reports.
- Entrepreneurs: Discover financial modeling techniques employed by leading kitchenware companies.
- Educators: Employ it as a resource to teach various valuation methodologies.
Contents of the Template
- Pre-Filled Data: Features Marssenger Kitchenware Co., Ltd.'s historical financials and projections.
- Discounted Cash Flow Model: An editable DCF valuation model with automated calculations.
- Weighted Average Cost of Capital (WACC): A specific sheet for calculating WACC using custom parameters.
- Key Financial Ratios: Evaluate Marssenger Kitchenware Co., Ltd.'s profitability, efficiency, and leverage.
- Customizable Inputs: Easily modify revenue growth, profit margins, and tax rates.
- User-Friendly Dashboard: Visual representations and tables summarizing essential valuation results.
Disclaimer
All information, articles, and product details provided on this website are for general informational and educational purposes only. We do not claim any ownership over, nor do we intend to infringe upon, any trademarks, copyrights, logos, brand names, or other intellectual property mentioned or depicted on this site. Such intellectual property remains the property of its respective owners, and any references here are made solely for identification or informational purposes, without implying any affiliation, endorsement, or partnership.
We make no representations or warranties, express or implied, regarding the accuracy, completeness, or suitability of any content or products presented. Nothing on this website should be construed as legal, tax, investment, financial, medical, or other professional advice. In addition, no part of this site—including articles or product references—constitutes a solicitation, recommendation, endorsement, advertisement, or offer to buy or sell any securities, franchises, or other financial instruments, particularly in jurisdictions where such activity would be unlawful.
All content is of a general nature and may not address the specific circumstances of any individual or entity. It is not a substitute for professional advice or services. Any actions you take based on the information provided here are strictly at your own risk. You accept full responsibility for any decisions or outcomes arising from your use of this website and agree to release us from any liability in connection with your use of, or reliance upon, the content or products found herein.