
|
Zhonghong Pulin Medical Products Co., Ltd. (300981.sz) Avaliação DCF |
Totalmente Editável: Adapte-Se Às Suas Necessidades No Excel Ou Planilhas
Design Profissional: Modelos Confiáveis E Padrão Da Indústria
Pré-Construídos Para Uso Rápido E Eficiente
Compatível com MAC/PC, totalmente desbloqueado
Não É Necessária Experiência; Fácil De Seguir
Zhonghong Pulin Medical Products Co., Ltd. (300981.SZ) Bundle
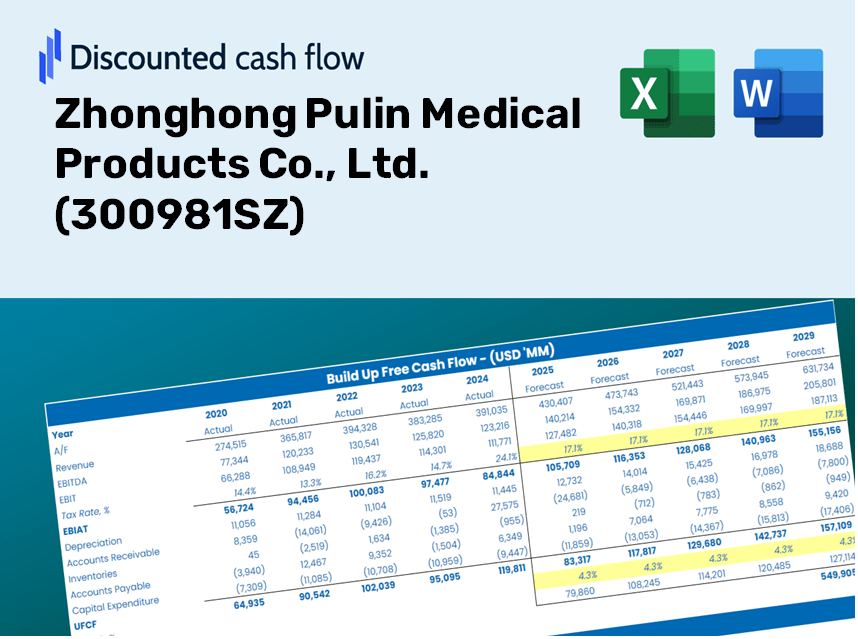
Explore as perspectivas financeiras da Zhonghong Pulin Medical Products Co., Ltd. (300981SZ) usando nossa calculadora DCF amigável! Digite suas projeções de crescimento, margens de lucro e despesas para calcular o valor intrínseco da Zhonghong Pulin Medical Products Co., Ltd. (300981SZ) e informe suas decisões de investimento.
What You Will Receive
- Pre-Filled Financial Model: Leverage Zhonghong Pulin Medical Products Co., Ltd.'s actual data for accurate DCF valuation.
- Comprehensive Forecast Control: Modify revenue growth, profit margins, WACC, and other essential variables.
- Real-Time Calculations: Instant updates allow you to view results instantly as you make adjustments.
- Investor-Ready Template: A polished Excel file crafted for professional-level valuation.
- Customizable and Reusable: Designed for adaptability, enabling repeated use for in-depth forecasts.
Key Features
- Accurate Financial Data: Gain access to reliable pre-loaded historical figures and forecasts for Zhonghong Pulin Medical Products Co., Ltd. (300981SZ).
- Adjustable Forecast Inputs: Modify highlighted cells for critical variables such as WACC, growth rates, and profit margins.
- Real-time Calculations: Enjoy automatic recalculations for DCF, Net Present Value (NPV), and cash flow analyses.
- User-Friendly Dashboard: Clear and engaging visualizations to help you interpret your valuation outcomes.
- Suitable for All Levels: Designed with a straightforward layout for investors, CFOs, and consultants alike.
How It Functions
- 1. Access the Template: Download and open the Excel file containing Zhonghong Pulin Medical Products Co., Ltd.'s preloaded data.
- 2. Adjust Assumptions: Modify essential inputs such as growth rates, WACC, and capital expenditures.
- 3. View Results in Real-Time: The DCF model automatically computes intrinsic value and NPV.
- 4. Explore Scenarios: Analyze various forecasts to evaluate different valuation possibilities.
- 5. Utilize with Assurance: Present clear and professional valuation insights to bolster your decision-making.
Why Opt for Zhonghong Pulin Medical Products Co., Ltd. ([300981SZ])?
- Save Time: Skip the hassle of building a financial model from the ground up – it's fully prepared for you.
- Enhance Accuracy: Dependable financial data and precise formulas minimize valuation errors.
- Completely Customizable: Adjust the model to align with your unique assumptions and forecasts.
- User-Friendly Insights: Intuitive charts and outputs ensure the results are straightforward to interpret.
- Recommended by Professionals: Crafted for experts who prioritize accuracy and ease of use.
Who Can Benefit from This Product?
- Investors: Evaluate Zhonghong Pulin Medical Products Co., Ltd.'s valuation prior to making stock trades in (300981SZ).
- CFOs and Financial Analysts: Enhance valuation methodologies and validate financial forecasts for (300981SZ).
- Startup Founders: Discover how established medical product companies like Zhonghong are appraised.
- Consultants: Produce detailed valuation reports tailored for clients focused on (300981SZ).
- Students and Educators: Leverage real financial data to practice and teach valuation strategies using (300981SZ).
What the Template Includes
- Pre-Filled DCF Model: Zhonghong Pulin Medical Products Co., Ltd.’s financial data preloaded for immediate analysis.
- WACC Calculator: Comprehensive calculations for Weighted Average Cost of Capital.
- Financial Ratios: Assess Zhonghong Pulin's profitability, leverage, and operational efficiency.
- Editable Inputs: Adjust assumptions like growth rates, margins, and capital expenditures to suit your projections.
- Financial Statements: Access annual and quarterly reports to facilitate in-depth analysis.
- Interactive Dashboard: Effortlessly visualize essential valuation metrics and outcomes.
Disclaimer
All information, articles, and product details provided on this website are for general informational and educational purposes only. We do not claim any ownership over, nor do we intend to infringe upon, any trademarks, copyrights, logos, brand names, or other intellectual property mentioned or depicted on this site. Such intellectual property remains the property of its respective owners, and any references here are made solely for identification or informational purposes, without implying any affiliation, endorsement, or partnership.
We make no representations or warranties, express or implied, regarding the accuracy, completeness, or suitability of any content or products presented. Nothing on this website should be construed as legal, tax, investment, financial, medical, or other professional advice. In addition, no part of this site—including articles or product references—constitutes a solicitation, recommendation, endorsement, advertisement, or offer to buy or sell any securities, franchises, or other financial instruments, particularly in jurisdictions where such activity would be unlawful.
All content is of a general nature and may not address the specific circumstances of any individual or entity. It is not a substitute for professional advice or services. Any actions you take based on the information provided here are strictly at your own risk. You accept full responsibility for any decisions or outcomes arising from your use of this website and agree to release us from any liability in connection with your use of, or reliance upon, the content or products found herein.