
|
DCM Holdings Co., Ltd. (3050.T) Avaliação DCF |
Totalmente Editável: Adapte-Se Às Suas Necessidades No Excel Ou Planilhas
Design Profissional: Modelos Confiáveis E Padrão Da Indústria
Pré-Construídos Para Uso Rápido E Eficiente
Compatível com MAC/PC, totalmente desbloqueado
Não É Necessária Experiência; Fácil De Seguir
DCM Holdings Co., Ltd. (3050.T) Bundle
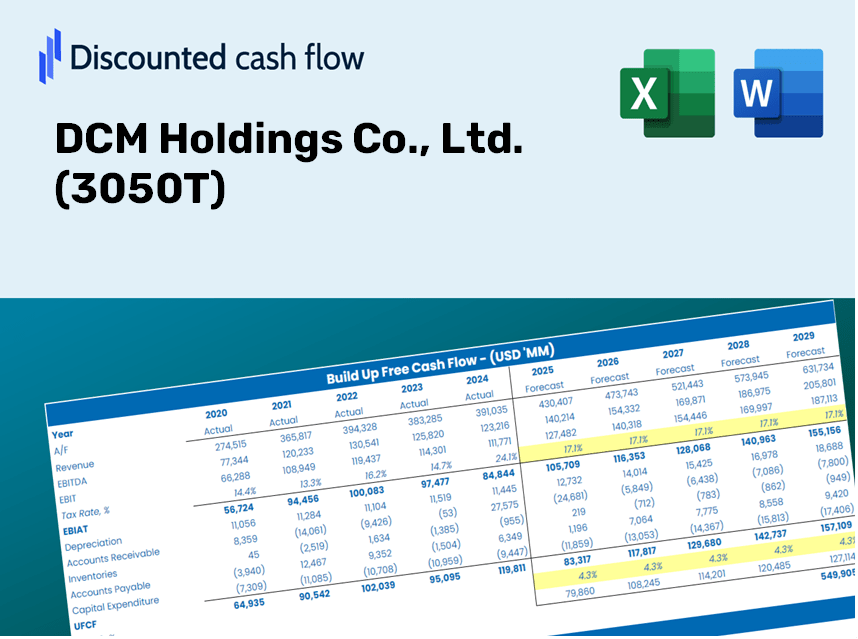
Seja você um investidor ou analista, esta calculadora DCF (3050T) é o seu recurso preferido para uma avaliação precisa. Equipado com dados reais da DCM Holdings Co., Ltd., você pode ajustar as previsões e observar instantaneamente os efeitos.
Benefits You Will Receive
- Comprehensive Financial Model: DCM Holdings Co., Ltd.’s actual data ensures accurate DCF valuation.
- Complete Forecasting Control: Modify revenue growth, profit margins, WACC, and other essential parameters.
- Real-Time Calculations: Instant updates allow you to see results as you make adjustments.
- Professional-Grade Template: A polished Excel file specifically crafted for high-quality valuation.
- Flexible and Reusable: Customizable for versatility, allowing for repeated use in detailed forecasts.
Key Features
- Comprehensive DCF Calculator: Features detailed unlevered and levered DCF valuation models tailored for DCM Holdings Co., Ltd. (3050T).
- WACC Calculator: Ready-to-use Weighted Average Cost of Capital template with adjustable inputs.
- Customizable Forecast Assumptions: Adjust growth rates, capital expenditures, and discount rates to fit your analysis.
- Integrated Financial Ratios: Evaluate profitability, leverage, and efficiency ratios specific to DCM Holdings Co., Ltd. (3050T).
- Interactive Dashboard and Charts: Visual representations of essential valuation metrics for intuitive analysis.
How It Operates
- Download the Template: Gain immediate access to the Excel-based DCM Holdings DCF Calculator.
- Input Your Assumptions: Modify the yellow-highlighted cells for growth rates, WACC, profit margins, and more.
- Instant Calculations: The model automatically recalculates DCM Holdings' intrinsic value.
- Test Scenarios: Experiment with various assumptions to assess potential changes in valuation.
- Analyze and Decide: Utilize the results to inform your investment or financial strategy.
Why Choose DCM Holdings Co., Ltd. (3050T) Calculator?
- Designed for Experts: A sophisticated tool utilized by analysts, CFOs, and consultants in the industry.
- Comprehensive Data: Historical and projected financials of DCM Holdings preloaded for precise analysis.
- Scenario Simulation: Effortlessly model various forecasts and assumptions.
- Transparent Results: Instantly computes intrinsic value, NPV, and essential metrics.
- User-Friendly: Step-by-step guidance makes navigation simple and intuitive.
Who Can Benefit from DCM Holdings Co., Ltd. (3050T)?
- Individual Investors: Gain insights to make well-informed choices regarding the purchase or sale of DCM Holdings stock.
- Financial Analysts: Enhance your valuation processes with accessible financial models tailored for DCM Holdings.
- Consultants: Provide your clients with accurate and timely valuation insights related to DCM Holdings.
- Business Owners: Learn how major corporations like DCM Holdings are valued to inform your own business strategy.
- Finance Students: Acquire valuation skills using real data and case studies from DCM Holdings.
Contents of the Template
- Operating and Balance Sheet Data: Pre-filled historical data and forecasts for DCM Holdings Co., Ltd. (3050T), including revenue, EBITDA, EBIT, and capital expenditures.
- WACC Calculation: A specific sheet for the Weighted Average Cost of Capital (WACC) with parameters such as Beta, risk-free rate, and share price.
- DCF Valuation (Unlevered and Levered): Customizable Discounted Cash Flow models that present intrinsic value along with detailed calculations.
- Financial Statements: Pre-loaded annual and quarterly financial statements to facilitate thorough analysis.
- Key Ratios: Comprehensive coverage of profitability, leverage, and efficiency ratios pertinent to DCM Holdings Co., Ltd. (3050T).
- Dashboard and Charts: A visual summary of valuation results and assumptions for straightforward analysis of outcomes.
Disclaimer
All information, articles, and product details provided on this website are for general informational and educational purposes only. We do not claim any ownership over, nor do we intend to infringe upon, any trademarks, copyrights, logos, brand names, or other intellectual property mentioned or depicted on this site. Such intellectual property remains the property of its respective owners, and any references here are made solely for identification or informational purposes, without implying any affiliation, endorsement, or partnership.
We make no representations or warranties, express or implied, regarding the accuracy, completeness, or suitability of any content or products presented. Nothing on this website should be construed as legal, tax, investment, financial, medical, or other professional advice. In addition, no part of this site—including articles or product references—constitutes a solicitation, recommendation, endorsement, advertisement, or offer to buy or sell any securities, franchises, or other financial instruments, particularly in jurisdictions where such activity would be unlawful.
All content is of a general nature and may not address the specific circumstances of any individual or entity. It is not a substitute for professional advice or services. Any actions you take based on the information provided here are strictly at your own risk. You accept full responsibility for any decisions or outcomes arising from your use of this website and agree to release us from any liability in connection with your use of, or reliance upon, the content or products found herein.