
|
Zozo, Inc. (3092.T) Avaliação DCF |
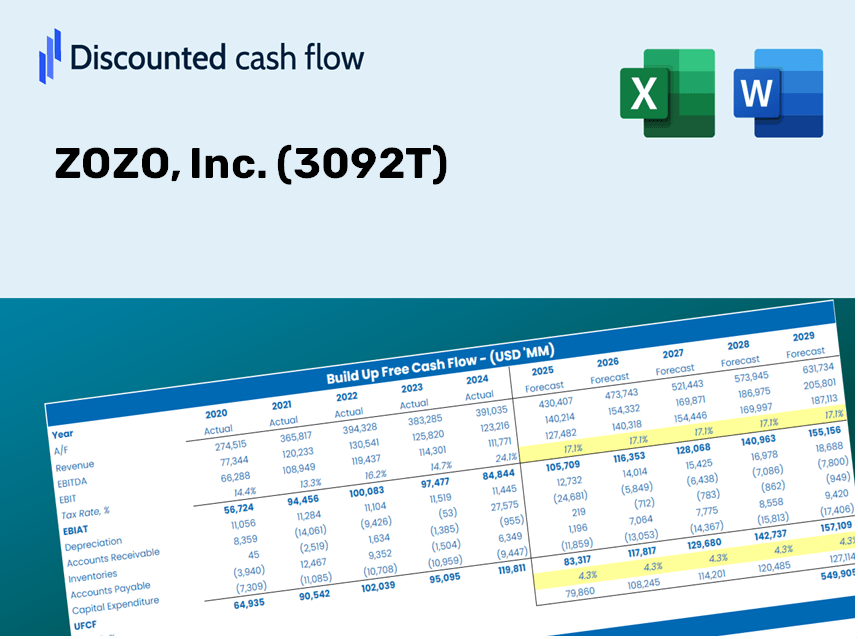
Totalmente Editável: Adapte-Se Às Suas Necessidades No Excel Ou Planilhas
Design Profissional: Modelos Confiáveis E Padrão Da Indústria
Pré-Construídos Para Uso Rápido E Eficiente
Compatível com MAC/PC, totalmente desbloqueado
Não É Necessária Experiência; Fácil De Seguir
ZOZO, Inc. (3092.T) Bundle
Aprimore suas opções de investimento com a calculadora DCF Zozo, Inc. (3092T)! Mergulhe nas autênticas finanças do Zozo, ajuste as previsões e despesas do crescimento e observe instantaneamente como essas mudanças afetam o valor intrínseco da Zozo, Inc. (3092T).
Discounted Cash Flow (DCF) - (USD MM)
| Year | AY1 2021 |
AY2 2022 |
AY3 2023 |
AY4 2024 |
AY5 2025 |
FY1 2026 |
FY2 2027 |
FY3 2028 |
FY4 2029 |
FY5 2030 |
|---|---|---|---|---|---|---|---|---|---|---|
| Revenue | 147,370.0 | 166,199.0 | 183,423.0 | 197,016.0 | 213,131.0 | 233,767.6 | 256,402.5 | 281,228.9 | 308,459.2 | 338,326.1 |
| Revenue Growth, % | 0 | 12.78 | 10.36 | 7.41 | 8.18 | 9.68 | 9.68 | 9.68 | 9.68 | 9.68 |
| EBITDA | 46,162.0 | 51,741.0 | 59,100.0 | 64,343.0 | 69,577.0 | 74,796.5 | 82,038.7 | 89,982.2 | 98,694.8 | 108,251.1 |
| EBITDA, % | 31.32 | 31.13 | 32.22 | 32.66 | 32.65 | 32 | 32 | 32 | 32 | 32 |
| Depreciation | 2,426.0 | 2,381.0 | 2,510.0 | 3,843.0 | 4,742.0 | 4,031.4 | 4,421.8 | 4,849.9 | 5,319.5 | 5,834.6 |
| Depreciation, % | 1.65 | 1.43 | 1.37 | 1.95 | 2.22 | 1.72 | 1.72 | 1.72 | 1.72 | 1.72 |
| EBIT | 43,736.0 | 49,360.0 | 56,590.0 | 60,500.0 | 64,835.0 | 70,765.0 | 77,616.9 | 85,132.3 | 93,375.3 | 102,416.5 |
| EBIT, % | 29.68 | 29.7 | 30.85 | 30.71 | 30.42 | 30.27 | 30.27 | 30.27 | 30.27 | 30.27 |
| Total Cash | 61,648.0 | 65,520.0 | 74,126.0 | 69,747.0 | 91,486.0 | 93,504.2 | 102,557.8 | 112,488.1 | 123,379.9 | 135,326.3 |
| Total Cash, percent | .0 | .0 | .0 | .0 | .0 | .0 | .0 | .0 | .0 | .0 |
| Account Receivables | 32,781.0 | 30,609.0 | 42,994.0 | 45,789.0 | 49,453.0 | 51,683.8 | 56,688.2 | 62,177.0 | 68,197.4 | 74,800.7 |
| Account Receivables, % | 22.24 | 18.42 | 23.44 | 23.24 | 23.2 | 22.11 | 22.11 | 22.11 | 22.11 | 22.11 |
| Inventories | 1,871.0 | 2,087.0 | 3,204.0 | 3,823.0 | 2,649.0 | 3,485.7 | 3,823.2 | 4,193.4 | 4,599.4 | 5,044.7 |
| Inventories, % | 1.27 | 1.26 | 1.75 | 1.94 | 1.24 | 1.49 | 1.49 | 1.49 | 1.49 | 1.49 |
| Accounts Payable | 147.0 | 373.0 | 532.0 | 259.0 | 189.0 | 390.1 | 427.9 | 469.3 | 514.7 | 564.6 |
| Accounts Payable, % | 0.09974893 | 0.22443 | 0.29004 | 0.13146 | 0.08867786 | 0.16687 | 0.16687 | 0.16687 | 0.16687 | 0.16687 |
| Capital Expenditure | -3,224.0 | -1,222.0 | -8,957.0 | -7,997.0 | -4,799.0 | -6,600.2 | -7,239.2 | -7,940.2 | -8,709.0 | -9,552.3 |
| Capital Expenditure, % | -2.19 | -0.73526 | -4.88 | -4.06 | -2.25 | -2.82 | -2.82 | -2.82 | -2.82 | -2.82 |
| Tax Rate, % | 29.92 | 29.92 | 29.92 | 29.92 | 29.92 | 29.92 | 29.92 | 29.92 | 29.92 | 29.92 |
| EBITAT | 30,982.3 | 34,543.8 | 39,490.4 | 44,395.3 | 45,433.6 | 50,110.5 | 54,962.5 | 60,284.3 | 66,121.4 | 72,523.7 |
| Depreciation | ||||||||||
| Changes in Account Receivables | ||||||||||
| Changes in Inventories | ||||||||||
| Changes in Accounts Payable | ||||||||||
| Capital Expenditure | ||||||||||
| UFCF | -4,320.7 | 37,884.8 | 19,700.4 | 36,554.3 | 42,816.6 | 44,675.4 | 46,841.0 | 51,376.4 | 56,351.0 | 61,807.2 |
| WACC, % | 6.66 | 6.66 | 6.66 | 6.66 | 6.66 | 6.66 | 6.66 | 6.66 | 6.66 | 6.66 |
| PV UFCF | ||||||||||
| SUM PV UFCF | 213,734.2 | |||||||||
| Long Term Growth Rate, % | 2.00 | |||||||||
| Free cash flow (T + 1) | 63,043 | |||||||||
| Terminal Value | 1,353,742 | |||||||||
| Present Terminal Value | 980,821 | |||||||||
| Enterprise Value | 1,194,555 | |||||||||
| Net Debt | -71,486 | |||||||||
| Equity Value | 1,266,041 | |||||||||
| Diluted Shares Outstanding, MM | 891 | |||||||||
| Equity Value Per Share | 1,421.13 |
What You Will Receive
- Authentic ZOZO Data: Preloaded financial information – from revenue to EBIT – based on real and projected statistics.
- Comprehensive Customization: Modify all essential parameters (yellow cells) such as WACC, growth %, and tax rates.
- Immediate Valuation Adjustments: Automatic recalculations to assess the effects of changes on ZOZO's fair value.
- Adaptable Excel Template: Designed for quick edits, scenario analysis, and detailed forecasting.
- Efficient and Accurate: Bypass the process of building models from the ground up while ensuring accuracy and flexibility.
Key Features
- Pre-Loaded Data: ZOZO, Inc.'s historical financial records and pre-filled projections.
- Fully Adjustable Inputs: Modify WACC, tax rates, revenue growth, and EBITDA margins.
- Instant Results: Watch ZOZO, Inc.'s intrinsic value update in real time.
- Clear Visual Outputs: Dashboard charts showcase valuation results and essential metrics.
- Built for Accuracy: A professional tool designed for analysts, investors, and finance professionals.
How It Operates
- Download the Template: Gain immediate access to the Excel-based ZOZO, Inc. (3092T) DCF Calculator.
- Input Your Assumptions: Modify the yellow-highlighted cells for growth rates, WACC, margins, and additional factors.
- Instant Calculations: The model will automatically refresh to display ZOZO, Inc.'s intrinsic value.
- Test Scenarios: Experiment with various assumptions to assess possible changes in valuation.
- Analyze and Decide: Utilize the outcomes to inform your investment or financial assessments.
Why Choose ZOZO, Inc. (3092T)?
- Time Efficiency: Skip the hassle of building a model from ground zero – it's ready for immediate use.
- Enhanced Accuracy: Dependable financial data and calculations minimize valuation errors.
- Completely Customizable: Adjust the model to mirror your unique assumptions and forecasts.
- User-Friendly: Intuitive charts and outputs simplify result interpretation.
- Expert Approved: Crafted for professionals who prioritize precision and functionality.
Who Can Benefit from This Product?
- Professional Investors: Create comprehensive and accurate valuation models for investment analysis in ZOZO, Inc. (3092T).
- Corporate Finance Teams: Evaluate various valuation scenarios to inform strategic decisions within the organization.
- Consultants and Advisors: Equip clients with precise valuation insights regarding ZOZO, Inc. (3092T) stock.
- Students and Educators: Utilize real-time data to enhance the learning and teaching of financial modeling concepts.
- Fashion Industry Enthusiasts: Gain insight into the market valuation of fashion and e-commerce companies like ZOZO, Inc. (3092T).
Contents of the Template
- Pre-Filled Data: Features ZOZO, Inc.'s historical financial data and projections.
- Discounted Cash Flow Model: Editable DCF valuation model with automatic computation.
- Weighted Average Cost of Capital (WACC): A specific sheet for calculating WACC using custom inputs.
- Key Financial Ratios: Assess ZOZO, Inc.'s profitability, efficiency, and leverage metrics.
- Customizable Inputs: Easily modify revenue growth, margin figures, and tax rates.
- Clear Dashboard: Visual representations and tables highlighting essential valuation outcomes.
Disclaimer
All information, articles, and product details provided on this website are for general informational and educational purposes only. We do not claim any ownership over, nor do we intend to infringe upon, any trademarks, copyrights, logos, brand names, or other intellectual property mentioned or depicted on this site. Such intellectual property remains the property of its respective owners, and any references here are made solely for identification or informational purposes, without implying any affiliation, endorsement, or partnership.
We make no representations or warranties, express or implied, regarding the accuracy, completeness, or suitability of any content or products presented. Nothing on this website should be construed as legal, tax, investment, financial, medical, or other professional advice. In addition, no part of this site—including articles or product references—constitutes a solicitation, recommendation, endorsement, advertisement, or offer to buy or sell any securities, franchises, or other financial instruments, particularly in jurisdictions where such activity would be unlawful.
All content is of a general nature and may not address the specific circumstances of any individual or entity. It is not a substitute for professional advice or services. Any actions you take based on the information provided here are strictly at your own risk. You accept full responsibility for any decisions or outcomes arising from your use of this website and agree to release us from any liability in connection with your use of, or reliance upon, the content or products found herein.