
|
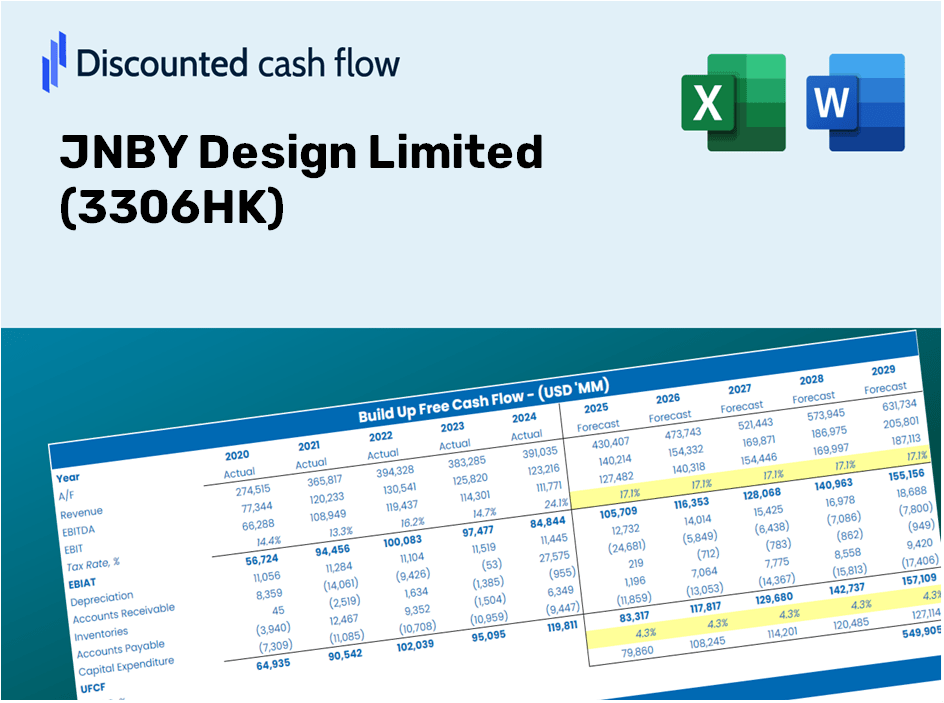
JNBY Design Limited (3306.hk) Avaliação DCF |
Totalmente Editável: Adapte-Se Às Suas Necessidades No Excel Ou Planilhas
Design Profissional: Modelos Confiáveis E Padrão Da Indústria
Pré-Construídos Para Uso Rápido E Eficiente
Compatível com MAC/PC, totalmente desbloqueado
Não É Necessária Experiência; Fácil De Seguir
JNBY Design Limited (3306.HK) Bundle
Procurando determinar o valor intrínseco da JNBY Design Limited? Nossa calculadora DCF (3306HK) integra dados do mundo real com recursos abrangentes de personalização, permitindo refinar suas previsões e aprimorar suas estratégias de investimento.
Discounted Cash Flow (DCF) - (USD MM)
| Year | AY1 2021 |
AY2 2022 |
AY3 2023 |
AY4 2024 |
AY5 2025 |
FY1 2026 |
FY2 2027 |
FY3 2028 |
FY4 2029 |
FY5 2030 |
|---|---|---|---|---|---|---|---|---|---|---|
| Revenue | 4,512.0 | 4,467.9 | 4,882.6 | 5,727.9 | 6,067.1 | 6,545.5 | 7,061.6 | 7,618.4 | 8,219.1 | 8,867.2 |
| Revenue Growth, % | 0 | -0.97806 | 9.28 | 17.31 | 5.92 | 7.88 | 7.88 | 7.88 | 7.88 | 7.88 |
| EBITDA | 1,035.9 | 930.7 | 1,051.5 | 1,823.5 | 1,466.8 | 1,588.4 | 1,713.7 | 1,848.8 | 1,994.6 | 2,151.8 |
| EBITDA, % | 22.96 | 20.83 | 21.54 | 31.84 | 24.18 | 24.27 | 24.27 | 24.27 | 24.27 | 24.27 |
| Depreciation | 75.0 | 101.5 | 128.0 | 455.7 | 142.0 | 220.6 | 238.0 | 256.8 | 277.0 | 298.9 |
| Depreciation, % | 1.66 | 2.27 | 2.62 | 7.96 | 2.34 | 3.37 | 3.37 | 3.37 | 3.37 | 3.37 |
| EBIT | 960.9 | 829.2 | 923.5 | 1,367.9 | 1,324.8 | 1,367.8 | 1,475.6 | 1,592.0 | 1,717.5 | 1,853.0 |
| EBIT, % | 21.3 | 18.56 | 18.91 | 23.88 | 21.84 | 20.9 | 20.9 | 20.9 | 20.9 | 20.9 |
| Total Cash | 1,552.2 | 1,184.7 | 1,242.4 | 1,690.4 | 1,292.3 | 1,795.7 | 1,937.3 | 2,090.1 | 2,254.9 | 2,432.7 |
| Total Cash, percent | .0 | .0 | .0 | .0 | .0 | .0 | .0 | .0 | .0 | .0 |
| Account Receivables | 133.1 | 116.0 | 138.8 | 308.1 | 142.3 | 210.9 | 227.5 | 245.5 | 264.8 | 285.7 |
| Account Receivables, % | 2.95 | 2.6 | 2.84 | 5.38 | 2.35 | 3.22 | 3.22 | 3.22 | 3.22 | 3.22 |
| Inventories | 772.9 | 906.3 | 864.2 | 787.4 | 1,019.7 | 1,121.5 | 1,209.9 | 1,305.3 | 1,408.3 | 1,519.3 |
| Inventories, % | 17.13 | 20.29 | 17.7 | 13.75 | 16.81 | 17.13 | 17.13 | 17.13 | 17.13 | 17.13 |
| Accounts Payable | 280.5 | 316.3 | 258.5 | 285.3 | 263.7 | 365.4 | 394.3 | 425.3 | 458.9 | 495.1 |
| Accounts Payable, % | 6.22 | 7.08 | 5.29 | 4.98 | 4.35 | 5.58 | 5.58 | 5.58 | 5.58 | 5.58 |
| Capital Expenditure | -135.7 | -147.0 | -162.6 | -9.4 | -164.3 | -163.7 | -176.6 | -190.5 | -205.5 | -221.7 |
| Capital Expenditure, % | -3.01 | -3.29 | -3.33 | -0.1633 | -2.71 | -2.5 | -2.5 | -2.5 | -2.5 | -2.5 |
| Tax Rate, % | 26.72 | 26.72 | 26.72 | 26.72 | 26.72 | 26.72 | 26.72 | 26.72 | 26.72 | 26.72 |
| EBITAT | 701.4 | 597.5 | 674.3 | 957.4 | 970.8 | 988.5 | 1,066.4 | 1,150.5 | 1,241.2 | 1,339.1 |
| Depreciation | ||||||||||
| Changes in Account Receivables | ||||||||||
| Changes in Inventories | ||||||||||
| Changes in Accounts Payable | ||||||||||
| Capital Expenditure | ||||||||||
| UFCF | 15.2 | 471.5 | 601.2 | 1,338.0 | 860.4 | 976.8 | 1,051.7 | 1,134.6 | 1,224.0 | 1,320.6 |
| WACC, % | 5.69 | 5.69 | 5.69 | 5.68 | 5.69 | 5.69 | 5.69 | 5.69 | 5.69 | 5.69 |
| PV UFCF | ||||||||||
| SUM PV UFCF | 4,809.3 | |||||||||
| Long Term Growth Rate, % | 0.50 | |||||||||
| Free cash flow (T + 1) | 1,327 | |||||||||
| Terminal Value | 25,578 | |||||||||
| Present Terminal Value | 19,397 | |||||||||
| Enterprise Value | 24,206 | |||||||||
| Net Debt | 351 | |||||||||
| Equity Value | 23,855 | |||||||||
| Diluted Shares Outstanding, MM | 525 | |||||||||
| Equity Value Per Share | 45.42 |
What You Will Receive
- Authentic JNBY Financial Data: Pre-loaded with historical and projected figures for accurate analysis.
- Customizable Template: Easily adjust key metrics such as revenue growth, WACC, and EBITDA %.
- Instant Calculations: Watch the intrinsic value of JNBY update in real-time as you make changes.
- Professional Valuation Tool: Crafted for investors, analysts, and consultants in need of precise DCF outcomes.
- User-Friendly Interface: Well-organized layout and straightforward instructions suitable for all skill levels.
Key Features
- Authentic JNBY Financials: Gain access to precise historical data and future forecasts for JNBY Design Limited (3306HK).
- Customizable Forecast Inputs: Modify highlighted fields such as WACC, growth rates, and profit margins to suit your analysis.
- Real-Time Calculations: Automatic adjustments to DCF, Net Present Value (NPV), and cash flow evaluations.
- Visual Analytics Dashboard: User-friendly charts and summaries that clearly present your valuation findings.
- Designed for All Skill Levels: An accessible and straightforward framework ideal for investors, CFOs, and consultants.
How It Works
- Step 1: Download the Excel file.
- Step 2: Review pre-filled JNBY Design Limited (3306HK) data (historical and projected).
- Step 3: Modify key assumptions (yellow cells) in line with your analysis.
- Step 4: Observe automatic recalculations for JNBY Design Limited's intrinsic value.
- Step 5: Utilize the results for your investment decisions or reporting purposes.
Reasons to Choose This Calculator for JNBY Design Limited (3306HK)
- User-Friendly Interface: Crafted for both novices and seasoned professionals.
- Customizable Variables: Adjust inputs easily to suit your specific analysis needs.
- Real-Time Feedback: Observe immediate updates to JNBY's valuation as you change inputs.
- Pre-Configured: Comes with JNBY's actual financial data for swift evaluations.
- Relied Upon by Experts: A favored tool among investors and analysts for data-driven decision-making.
Who Should Consider JNBY Design Limited (3306HK)?
- Professional Investors: Develop comprehensive and trustworthy valuation models for investment analysis.
- Corporate Finance Teams: Evaluate valuation scenarios to inform corporate strategy and decision-making.
- Consultants and Advisors: Offer clients precise valuation insights for JNBY Design Limited (3306HK).
- Students and Educators: Utilize real-world data to enhance learning and practice in financial modeling.
- Fashion Enthusiasts: Gain insights into how fashion companies like JNBY are assessed in the market.
Contents of the Template
- Pre-Filled Data: Features JNBY Design Limited’s historical financial performance and projections.
- Discounted Cash Flow Model: An editable DCF valuation model with automatic computation tools.
- Weighted Average Cost of Capital (WACC): A specific sheet designed for WACC calculations using tailored inputs.
- Key Financial Ratios: Evaluate JNBY Design Limited’s profitability, operational efficiency, and financial leverage.
- Customizable Inputs: Easily modify parameters such as revenue growth, profit margins, and tax rates.
- Clear Dashboard: Visual representations and tables that summarize essential valuation outcomes.
Disclaimer
All information, articles, and product details provided on this website are for general informational and educational purposes only. We do not claim any ownership over, nor do we intend to infringe upon, any trademarks, copyrights, logos, brand names, or other intellectual property mentioned or depicted on this site. Such intellectual property remains the property of its respective owners, and any references here are made solely for identification or informational purposes, without implying any affiliation, endorsement, or partnership.
We make no representations or warranties, express or implied, regarding the accuracy, completeness, or suitability of any content or products presented. Nothing on this website should be construed as legal, tax, investment, financial, medical, or other professional advice. In addition, no part of this site—including articles or product references—constitutes a solicitation, recommendation, endorsement, advertisement, or offer to buy or sell any securities, franchises, or other financial instruments, particularly in jurisdictions where such activity would be unlawful.
All content is of a general nature and may not address the specific circumstances of any individual or entity. It is not a substitute for professional advice or services. Any actions you take based on the information provided here are strictly at your own risk. You accept full responsibility for any decisions or outcomes arising from your use of this website and agree to release us from any liability in connection with your use of, or reliance upon, the content or products found herein.