
|
Toray Industries, Inc. (3402.T) Avaliação DCF |
Totalmente Editável: Adapte-Se Às Suas Necessidades No Excel Ou Planilhas
Design Profissional: Modelos Confiáveis E Padrão Da Indústria
Pré-Construídos Para Uso Rápido E Eficiente
Compatível com MAC/PC, totalmente desbloqueado
Não É Necessária Experiência; Fácil De Seguir
Toray Industries, Inc. (3402.T) Bundle
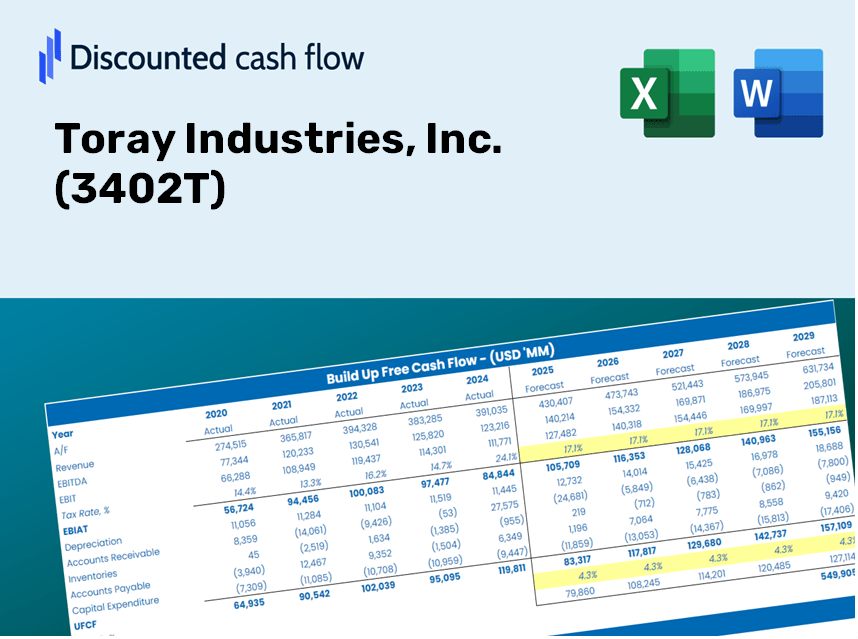
Obtenha informações sobre sua análise de avaliação da Toray Industries, Inc. (3402T) com nossa calculadora DCF de ponta! Pré -carregado com dados reais (3402T), este modelo do Excel permite ajustar as previsões e suposições para determinar com precisão o valor intrínseco da Toray Industries, Inc.
Discounted Cash Flow (DCF) - (USD MM)
| Year | AY1 2021 |
AY2 2022 |
AY3 2023 |
AY4 2024 |
AY5 2025 |
FY1 2026 |
FY2 2027 |
FY3 2028 |
FY4 2029 |
FY5 2030 |
|---|---|---|---|---|---|---|---|---|---|---|
| Revenue | 1,883,600.0 | 2,228,523.0 | 2,489,330.0 | 2,464,596.0 | 2,563,280.0 | 2,774,914.0 | 3,004,021.3 | 3,252,044.5 | 3,520,545.5 | 3,811,215.0 |
| Revenue Growth, % | 0 | 18.31 | 11.7 | -0.9936 | 4 | 8.26 | 8.26 | 8.26 | 8.26 | 8.26 |
| EBITDA | 176,449.0 | 227,595.0 | 242,652.0 | 197,913.0 | 267,640.0 | 265,280.1 | 287,182.6 | 310,893.5 | 336,562.0 | 364,349.9 |
| EBITDA, % | 9.37 | 10.21 | 9.75 | 8.03 | 10.44 | 9.56 | 9.56 | 9.56 | 9.56 | 9.56 |
| Depreciation | 115,819.0 | 120,369.0 | 126,375.0 | 129,194.0 | 129,095.0 | 149,318.6 | 161,646.9 | 174,993.1 | 189,441.1 | 205,082.1 |
| Depreciation, % | 6.15 | 5.4 | 5.08 | 5.24 | 5.04 | 5.38 | 5.38 | 5.38 | 5.38 | 5.38 |
| EBIT | 60,630.0 | 107,226.0 | 116,277.0 | 68,719.0 | 138,545.0 | 115,961.5 | 125,535.7 | 135,900.4 | 147,120.9 | 159,267.7 |
| EBIT, % | 3.22 | 4.81 | 4.67 | 2.79 | 5.4 | 4.18 | 4.18 | 4.18 | 4.18 | 4.18 |
| Total Cash | 236,354.0 | 229,301.0 | 223,995.0 | 235,887.0 | 237,295.0 | 281,176.8 | 304,391.9 | 329,523.6 | 356,730.3 | 386,183.3 |
| Total Cash, percent | .0 | .0 | .0 | .0 | .0 | .0 | .0 | .0 | .0 | .0 |
| Account Receivables | 522,259.0 | 576,867.0 | 586,114.0 | 659,600.0 | 605,967.0 | 707,939.5 | 766,389.6 | 829,665.6 | 898,165.9 | 972,321.8 |
| Account Receivables, % | 27.73 | 25.89 | 23.55 | 26.76 | 23.64 | 25.51 | 25.51 | 25.51 | 25.51 | 25.51 |
| Inventories | 369,110.0 | 469,316.0 | 521,598.0 | 531,959.0 | 520,505.0 | 574,402.1 | 621,826.9 | 673,167.2 | 728,746.4 | 788,914.5 |
| Inventories, % | 19.6 | 21.06 | 20.95 | 21.58 | 20.31 | 20.7 | 20.7 | 20.7 | 20.7 | 20.7 |
| Accounts Payable | 282,812.0 | 327,454.0 | 327,454.0 | 340,256.0 | 315,896.0 | 382,894.6 | 414,507.8 | 448,731.2 | 485,780.1 | 525,887.9 |
| Accounts Payable, % | 15.01 | 14.69 | 13.15 | 13.81 | 12.32 | 13.8 | 13.8 | 13.8 | 13.8 | 13.8 |
| Capital Expenditure | -122,483.0 | -92,195.0 | -102,216.0 | -134,130.0 | -179,248.0 | -150,849.9 | -163,304.6 | -176,787.6 | -191,383.9 | -207,185.3 |
| Capital Expenditure, % | -6.5 | -4.14 | -4.11 | -5.44 | -6.99 | -5.44 | -5.44 | -5.44 | -5.44 | -5.44 |
| Tax Rate, % | 33.2 | 33.2 | 33.2 | 33.2 | 33.2 | 33.2 | 33.2 | 33.2 | 33.2 | 33.2 |
| EBITAT | 42,346.5 | 75,071.1 | 75,691.8 | 25,261.3 | 92,543.5 | 71,550.4 | 77,457.9 | 83,853.1 | 90,776.3 | 98,271.1 |
| Depreciation | ||||||||||
| Changes in Account Receivables | ||||||||||
| Changes in Inventories | ||||||||||
| Changes in Accounts Payable | ||||||||||
| Capital Expenditure | ||||||||||
| UFCF | -572,874.5 | -6,926.9 | 38,321.8 | -50,719.7 | 83,117.5 | -18,851.8 | 1,538.5 | 1,665.5 | 1,803.0 | 1,951.9 |
| WACC, % | 5.34 | 5.35 | 5.28 | 4.9 | 5.3 | 5.24 | 5.24 | 5.24 | 5.24 | 5.24 |
| PV UFCF | ||||||||||
| SUM PV UFCF | -12,113.3 | |||||||||
| Long Term Growth Rate, % | 3.00 | |||||||||
| Free cash flow (T + 1) | 2,010 | |||||||||
| Terminal Value | 89,934 | |||||||||
| Present Terminal Value | 69,681 | |||||||||
| Enterprise Value | 57,568 | |||||||||
| Net Debt | 605,364 | |||||||||
| Equity Value | -547,796 | |||||||||
| Diluted Shares Outstanding, MM | 1,595 | |||||||||
| Equity Value Per Share | -343.39 |
What You Will Receive
- Authentic Toray Industries Financial Data: Automatically populated with historical and forecasted data for detailed analysis.
- Completely Customizable Template: Easily adjust crucial inputs such as revenue growth, WACC, and EBITDA percentage.
- Instant Calculations: Watch Toray Industries' intrinsic value update in real-time as you make changes.
- Professional Valuation Tool: Tailored for investors, analysts, and consultants aiming for precise DCF results.
- User-Friendly Interface: Designed with a straightforward layout and clear guidance suitable for all skill levels.
Key Features
- Accurate Financial Data: Gain access to reliable pre-loaded historical figures and future estimates for Toray Industries, Inc. (3402T).
- Adjustable Forecast Parameters: Modify the highlighted cells for metrics such as WACC, growth rates, and profit margins.
- Automated Calculations: Instant updates for DCF, Net Present Value (NPV), and cash flow assessments.
- User-Friendly Dashboard: Clear charts and summaries to help you interpret your valuation outcomes.
- Suitable for All Skill Levels: An intuitive layout designed for investors, CFOs, and consultants alike.
How It Functions
- Step 1: Download the Excel file for Toray Industries, Inc. (3402T).
- Step 2: Examine the pre-filled financial data and projections for Toray Industries.
- Step 3: Adjust key inputs such as revenue growth, WACC, and tax rates (highlighted cells).
- Step 4: Observe how the DCF model updates in real-time as you modify your assumptions.
- Step 5: Evaluate the outputs and leverage the findings for your investment strategies.
Why Choose This Calculator for Toray Industries, Inc. (3402T)?
- Reliable Data: Utilize accurate financial information from Toray Industries to achieve trustworthy valuation outcomes.
- Fully Customizable: Tailor essential metrics such as growth projections, WACC, and tax rates to align with your expectations.
- Efficiency Boost: Pre-configured calculations save you the hassle of building from the ground up.
- Professional Quality: Crafted for use by investors, analysts, and consulting professionals.
- Easy to Use: A user-friendly interface with clear, step-by-step guidance ensures accessibility for everyone.
Who Can Benefit from This Product?
- Investors: Evaluate Toray Industries, Inc. (3402T) to make informed buy or sell decisions.
- CFOs and Financial Analysts: Optimize valuation workflows and assess financial forecasts.
- Startup Founders: Gain insights into the valuation strategies of established firms like Toray Industries, Inc.
- Consultants: Provide expert valuation assessments for client projects.
- Students and Educators: Utilize current data to enhance learning and application of valuation methods.
Contents of the Template
- Historical Data: Provides past financial information and baseline forecasts for Toray Industries, Inc. (3402T).
- DCF and Levered DCF Models: Comprehensive templates to assess the intrinsic value of Toray Industries, Inc. (3402T).
- WACC Sheet: Pre-configured calculations for the Weighted Average Cost of Capital.
- Editable Inputs: Adjust key parameters such as growth rates, EBITDA percentages, and capital expenditure assumptions.
- Quarterly and Annual Statements: A thorough analysis of the financials of Toray Industries, Inc. (3402T).
- Interactive Dashboard: Dynamically visualize valuation results and projections.
Disclaimer
All information, articles, and product details provided on this website are for general informational and educational purposes only. We do not claim any ownership over, nor do we intend to infringe upon, any trademarks, copyrights, logos, brand names, or other intellectual property mentioned or depicted on this site. Such intellectual property remains the property of its respective owners, and any references here are made solely for identification or informational purposes, without implying any affiliation, endorsement, or partnership.
We make no representations or warranties, express or implied, regarding the accuracy, completeness, or suitability of any content or products presented. Nothing on this website should be construed as legal, tax, investment, financial, medical, or other professional advice. In addition, no part of this site—including articles or product references—constitutes a solicitation, recommendation, endorsement, advertisement, or offer to buy or sell any securities, franchises, or other financial instruments, particularly in jurisdictions where such activity would be unlawful.
All content is of a general nature and may not address the specific circumstances of any individual or entity. It is not a substitute for professional advice or services. Any actions you take based on the information provided here are strictly at your own risk. You accept full responsibility for any decisions or outcomes arising from your use of this website and agree to release us from any liability in connection with your use of, or reliance upon, the content or products found herein.