
|
Comida & Life Companies Ltd. (3563.T) Avaliação DCF |
Totalmente Editável: Adapte-Se Às Suas Necessidades No Excel Ou Planilhas
Design Profissional: Modelos Confiáveis E Padrão Da Indústria
Pré-Construídos Para Uso Rápido E Eficiente
Compatível com MAC/PC, totalmente desbloqueado
Não É Necessária Experiência; Fácil De Seguir
Food & Life Companies Ltd. (3563.T) Bundle
Aprimore sua análise de avaliação de alimentos & Life Companies Ltd. (3563T) com nossa poderosa calculadora DCF! Este modelo do Excel é pré -carregado com dados reais (3563T), permitindo que você ajuste as previsões e suposições para determinar com precisão o valor intrínseco de alimentos & Life Companies Ltd.
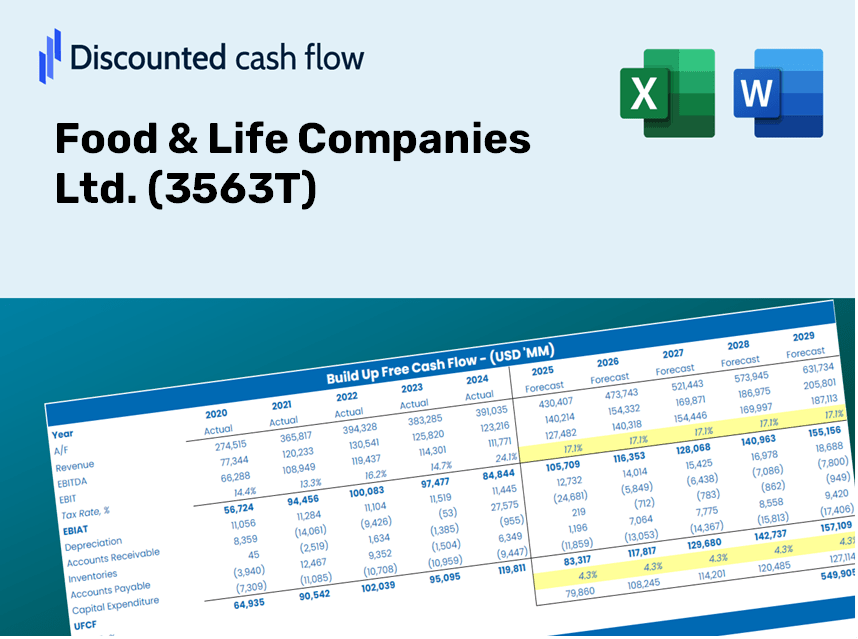
Discounted Cash Flow (DCF) - (USD MM)
| Year | AY1 2020 |
AY2 2021 |
AY3 2022 |
AY4 2023 |
AY5 2024 |
FY1 2025 |
FY2 2026 |
FY3 2027 |
FY4 2028 |
FY5 2029 |
|---|---|---|---|---|---|---|---|---|---|---|
| Revenue | 204,957.0 | 240,804.0 | 281,301.0 | 301,747.0 | 361,129.0 | 416,431.6 | 480,203.1 | 553,740.4 | 638,539.1 | 736,323.7 |
| Revenue Growth, % | 0 | 17.49 | 16.82 | 7.27 | 19.68 | 15.31 | 15.31 | 15.31 | 15.31 | 15.31 |
| EBITDA | 26,542.0 | 41,525.0 | 33,523.0 | 37,964.0 | 54,595.0 | 58,142.8 | 67,046.7 | 77,314.1 | 89,153.8 | 102,806.6 |
| EBITDA, % | 12.95 | 17.24 | 11.92 | 12.58 | 15.12 | 13.96 | 13.96 | 13.96 | 13.96 | 13.96 |
| Depreciation | 15,233.0 | 18,584.0 | 22,925.0 | 26,586.0 | 30,760.0 | 33,837.4 | 39,019.2 | 44,994.5 | 51,884.9 | 59,830.5 |
| Depreciation, % | 7.43 | 7.72 | 8.15 | 8.81 | 8.52 | 8.13 | 8.13 | 8.13 | 8.13 | 8.13 |
| EBIT | 11,309.0 | 22,941.0 | 10,598.0 | 11,378.0 | 23,835.0 | 24,305.4 | 28,027.5 | 32,319.5 | 37,268.9 | 42,976.1 |
| EBIT, % | 5.52 | 9.53 | 3.77 | 3.77 | 6.6 | 5.84 | 5.84 | 5.84 | 5.84 | 5.84 |
| Total Cash | 12,665.0 | 29,367.0 | 50,637.0 | 51,228.0 | 51,635.0 | 56,344.1 | 64,972.5 | 74,922.3 | 86,395.7 | 99,626.2 |
| Total Cash, percent | .0 | .0 | .0 | .0 | .0 | .0 | .0 | .0 | .0 | .0 |
| Account Receivables | 5,142.0 | 15,004.0 | 11,397.0 | 12,457.0 | 13,882.0 | 17,293.1 | 19,941.4 | 22,995.2 | 26,516.6 | 30,577.3 |
| Account Receivables, % | 2.51 | 6.23 | 4.05 | 4.13 | 3.84 | 4.15 | 4.15 | 4.15 | 4.15 | 4.15 |
| Inventories | 1,687.0 | 2,146.0 | 3,534.0 | 3,965.0 | 6,512.0 | 5,070.3 | 5,846.8 | 6,742.2 | 7,774.6 | 8,965.2 |
| Inventories, % | 0.8231 | 0.89118 | 1.26 | 1.31 | 1.8 | 1.22 | 1.22 | 1.22 | 1.22 | 1.22 |
| Accounts Payable | 22,150.0 | 26,676.0 | 27,435.0 | 30,080.0 | 35,569.0 | 42,855.8 | 49,418.6 | 56,986.5 | 65,713.3 | 75,776.4 |
| Accounts Payable, % | 10.81 | 11.08 | 9.75 | 9.97 | 9.85 | 10.29 | 10.29 | 10.29 | 10.29 | 10.29 |
| Capital Expenditure | -12,599.0 | -13,601.0 | -17,934.0 | -16,712.0 | -20,726.0 | -24,526.4 | -28,282.3 | -32,613.4 | -37,607.8 | -43,367.0 |
| Capital Expenditure, % | -6.15 | -5.65 | -6.38 | -5.54 | -5.74 | -5.89 | -5.89 | -5.89 | -5.89 | -5.89 |
| Tax Rate, % | 32.42 | 32.42 | 32.42 | 32.42 | 32.42 | 32.42 | 32.42 | 32.42 | 32.42 | 32.42 |
| EBITAT | 6,930.7 | 14,013.9 | 5,053.8 | 9,279.8 | 16,107.6 | 15,516.4 | 17,892.6 | 20,632.6 | 23,792.2 | 27,435.7 |
| Depreciation | ||||||||||
| Changes in Account Receivables | ||||||||||
| Changes in Inventories | ||||||||||
| Changes in Accounts Payable | ||||||||||
| Capital Expenditure | ||||||||||
| UFCF | 24,885.7 | 13,201.9 | 13,022.8 | 20,307.8 | 27,658.6 | 30,144.7 | 31,767.6 | 36,632.4 | 42,242.2 | 48,711.1 |
| WACC, % | 5.66 | 5.66 | 5.56 | 5.81 | 5.71 | 5.68 | 5.68 | 5.68 | 5.68 | 5.68 |
| PV UFCF | ||||||||||
| SUM PV UFCF | 158,839.4 | |||||||||
| Long Term Growth Rate, % | 2.90 | |||||||||
| Free cash flow (T + 1) | 50,124 | |||||||||
| Terminal Value | 1,804,634 | |||||||||
| Present Terminal Value | 1,369,230 | |||||||||
| Enterprise Value | 1,528,069 | |||||||||
| Net Debt | 168,189 | |||||||||
| Equity Value | 1,359,880 | |||||||||
| Diluted Shares Outstanding, MM | 116 | |||||||||
| Equity Value Per Share | 11,739.20 |
What You Will Receive
- Customizable Excel Template: A tailor-made DCF Calculator in Excel featuring pre-filled financials for Food & Life Companies Ltd. (3563T).
- Accurate Data: Access to historical figures and forward-looking projections (highlighted in the yellow cells).
- Adjustable Forecasts: Modify key assumptions such as revenue growth, EBITDA margins, and WACC as needed.
- Instant Calculations: See real-time effects of your inputs on the valuation of Food & Life Companies Ltd. (3563T).
- Professional Resource: Designed for investors, CFOs, consultants, and financial analysts.
- Intuitive Interface: Organized for easy navigation and use, complete with step-by-step guidance.
Key Features
- Comprehensive Historical Data: Pre-loaded with Food & Life Companies Ltd.'s (3563T) past financial performance and future forecasts.
- Customizable Financial Parameters: Tailor inputs such as revenue growth rates, profit margins, discount rates, tax percentages, and capital investments.
- Interactive Valuation Framework: Automatic recalculations of Net Present Value (NPV) and intrinsic worth in response to your adjustments.
- Forecast Scenario Analysis: Develop various forecasting scenarios to explore different valuation possibilities.
- Intuitive User Interface: Designed for ease of use, catering to both industry professionals and newcomers.
How It Works
- 1. Access the Template: Download and open the Excel file containing Food & Life Companies Ltd.'s preloaded data.
- 2. Modify Assumptions: Adjust key variables such as growth projections, WACC, and capital expenditures.
- 3. View Results Immediately: The DCF model automatically calculates the intrinsic value and NPV.
- 4. Explore Scenarios: Analyze various forecasts to evaluate different valuation results.
- 5. Utilize with Assurance: Deliver professional valuation analyses to bolster your decision-making process.
Why Opt for This Calculator?
- Reliable Data: Authentic financial figures from Food & Life Companies Ltd. ensure trustworthy valuation outcomes.
- Tailorable: Modify essential parameters like growth rates, WACC, and tax rates to align with your forecasts.
- Efficient: Built-in calculations save you the hassle of starting from the ground up.
- Industry-Grade Tool: Crafted for investors, analysts, and consultants alike.
- Easy to Use: User-friendly design and guided instructions make it accessible for everyone.
Who Can Benefit from This Product?
- Investors: Assess Food & Life Companies Ltd. (3563T) valuation prior to making stock trades.
- CFOs and Financial Analysts: Enhance efficiency in valuation processes and evaluate financial forecasts.
- Startup Founders: Understand the valuation methods used for established companies like Food & Life Companies Ltd. (3563T).
- Consultants: Create detailed valuation reports for your clients based on Food & Life Companies Ltd. (3563T).
- Students and Educators: Utilize real-world data from Food & Life Companies Ltd. (3563T) to learn and teach valuation methodologies.
Contents of the Template
- Pre-Filled Data: Contains Food & Life Companies Ltd.'s historical financials and projections.
- Discounted Cash Flow Model: Editable DCF valuation model with automatic computations.
- Weighted Average Cost of Capital (WACC): A dedicated sheet for WACC calculations based on user-defined inputs.
- Key Financial Ratios: Examine Food & Life Companies Ltd.'s profitability, efficiency, and leverage metrics.
- Customizable Inputs: Easily modify revenue growth, profit margins, and tax rates.
- User-Friendly Dashboard: Visuals and tables summarizing important valuation outcomes.
Disclaimer
All information, articles, and product details provided on this website are for general informational and educational purposes only. We do not claim any ownership over, nor do we intend to infringe upon, any trademarks, copyrights, logos, brand names, or other intellectual property mentioned or depicted on this site. Such intellectual property remains the property of its respective owners, and any references here are made solely for identification or informational purposes, without implying any affiliation, endorsement, or partnership.
We make no representations or warranties, express or implied, regarding the accuracy, completeness, or suitability of any content or products presented. Nothing on this website should be construed as legal, tax, investment, financial, medical, or other professional advice. In addition, no part of this site—including articles or product references—constitutes a solicitation, recommendation, endorsement, advertisement, or offer to buy or sell any securities, franchises, or other financial instruments, particularly in jurisdictions where such activity would be unlawful.
All content is of a general nature and may not address the specific circumstances of any individual or entity. It is not a substitute for professional advice or services. Any actions you take based on the information provided here are strictly at your own risk. You accept full responsibility for any decisions or outcomes arising from your use of this website and agree to release us from any liability in connection with your use of, or reliance upon, the content or products found herein.