
|
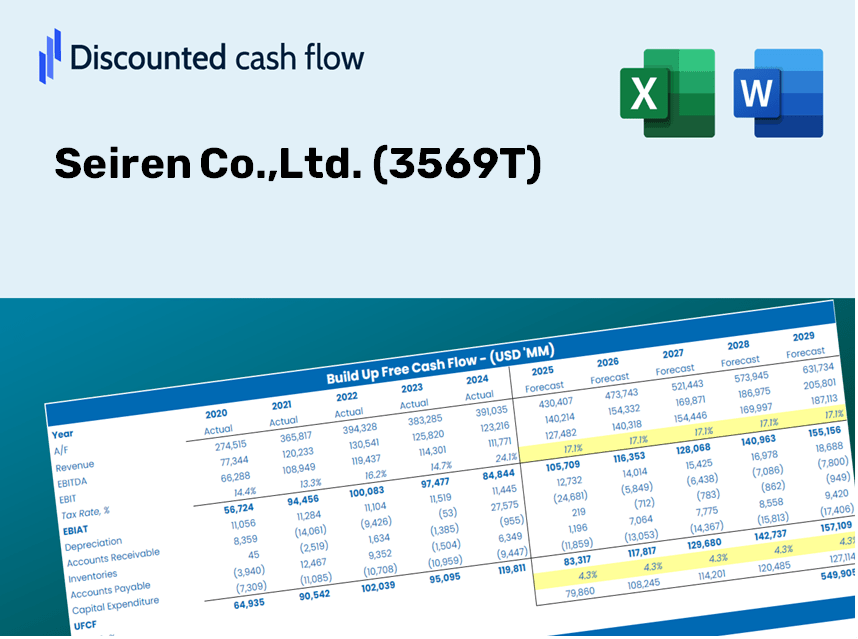
Seiren Co., Ltd. (3569.T) Avaliação do DCF |
Totalmente Editável: Adapte-Se Às Suas Necessidades No Excel Ou Planilhas
Design Profissional: Modelos Confiáveis E Padrão Da Indústria
Pré-Construídos Para Uso Rápido E Eficiente
Compatível com MAC/PC, totalmente desbloqueado
Não É Necessária Experiência; Fácil De Seguir
Seiren Co.,Ltd. (3569.T) Bundle
Atualize seu processo e melhore a precisão com a nossa calculadora DCF (3569T)! Utilizando dados reais da Seiren Co., Ltd. e suposições personalizáveis, essa ferramenta o capacita a prever, analisar e valorizar a Seiren Co., Ltd., como um investidor experiente.
Discounted Cash Flow (DCF) - (USD MM)
| Year | AY1 2021 |
AY2 2022 |
AY3 2023 |
AY4 2024 |
AY5 2025 |
FY1 2026 |
FY2 2027 |
FY3 2028 |
FY4 2029 |
FY5 2030 |
|---|---|---|---|---|---|---|---|---|---|---|
| Revenue | 98,688.0 | 109,771.0 | 132,364.0 | 141,915.0 | 159,653.0 | 180,219.1 | 203,434.5 | 229,640.4 | 259,222.1 | 292,614.5 |
| Revenue Growth, % | 0 | 11.23 | 20.58 | 7.22 | 12.5 | 12.88 | 12.88 | 12.88 | 12.88 | 12.88 |
| EBITDA | 12,968.0 | 16,598.0 | 20,307.0 | 22,016.0 | 25,586.0 | 27,084.1 | 30,573.1 | 34,511.4 | 38,957.1 | 43,975.4 |
| EBITDA, % | 13.14 | 15.12 | 15.34 | 15.51 | 16.03 | 15.03 | 15.03 | 15.03 | 15.03 | 15.03 |
| Depreciation | 4,720.0 | 4,863.0 | 5,313.0 | 5,455.0 | 6,030.0 | 7,514.3 | 8,482.2 | 9,574.9 | 10,808.3 | 12,200.6 |
| Depreciation, % | 4.78 | 4.43 | 4.01 | 3.84 | 3.78 | 4.17 | 4.17 | 4.17 | 4.17 | 4.17 |
| EBIT | 8,248.0 | 11,735.0 | 14,994.0 | 16,561.0 | 19,556.0 | 19,569.9 | 22,090.8 | 24,936.5 | 28,148.8 | 31,774.8 |
| EBIT, % | 8.36 | 10.69 | 11.33 | 11.67 | 12.25 | 10.86 | 10.86 | 10.86 | 10.86 | 10.86 |
| Total Cash | 42,635.0 | 39,593.0 | 39,873.0 | 46,929.0 | 51,919.0 | 63,070.4 | 71,195.0 | 80,366.1 | 90,718.7 | 102,404.9 |
| Total Cash, percent | .0 | .0 | .0 | .0 | .0 | .0 | .0 | .0 | .0 | .0 |
| Account Receivables | 26,294.0 | 28,913.0 | 33,059.0 | 39,260.0 | 42,222.0 | 47,602.8 | 53,734.9 | 60,656.9 | 68,470.6 | 77,290.8 |
| Account Receivables, % | 26.64 | 26.34 | 24.98 | 27.66 | 26.45 | 26.41 | 26.41 | 26.41 | 26.41 | 26.41 |
| Inventories | 17,647.0 | 22,520.0 | 25,222.0 | 26,623.0 | 29,386.0 | 34,104.0 | 38,497.2 | 43,456.3 | 49,054.2 | 55,373.2 |
| Inventories, % | 17.88 | 20.52 | 19.06 | 18.76 | 18.41 | 18.92 | 18.92 | 18.92 | 18.92 | 18.92 |
| Accounts Payable | 15,176.0 | 15,648.0 | 17,450.0 | 20,676.0 | 23,492.0 | 25,987.6 | 29,335.2 | 33,114.1 | 37,379.8 | 42,195.0 |
| Accounts Payable, % | 15.38 | 14.26 | 13.18 | 14.57 | 14.71 | 14.42 | 14.42 | 14.42 | 14.42 | 14.42 |
| Capital Expenditure | -3,226.0 | -8,089.0 | -8,354.0 | -4,302.0 | -5,781.0 | -8,506.9 | -9,602.8 | -10,839.8 | -12,236.1 | -13,812.4 |
| Capital Expenditure, % | -3.27 | -7.37 | -6.31 | -3.03 | -3.62 | -4.72 | -4.72 | -4.72 | -4.72 | -4.72 |
| Tax Rate, % | 28.07 | 28.07 | 28.07 | 28.07 | 28.07 | 28.07 | 28.07 | 28.07 | 28.07 | 28.07 |
| EBITAT | 6,289.4 | 8,574.9 | 11,050.3 | 12,262.6 | 14,067.6 | 14,442.7 | 16,303.1 | 18,403.3 | 20,773.9 | 23,450.0 |
| Depreciation | ||||||||||
| Changes in Account Receivables | ||||||||||
| Changes in Inventories | ||||||||||
| Changes in Accounts Payable | ||||||||||
| Capital Expenditure | ||||||||||
| UFCF | -20,981.6 | -1,671.1 | 2,963.3 | 9,039.6 | 11,407.6 | 5,846.8 | 8,005.0 | 9,036.2 | 10,200.2 | 11,514.2 |
| WACC, % | 5.04 | 5.04 | 5.04 | 5.04 | 5.04 | 5.04 | 5.04 | 5.04 | 5.04 | 5.04 |
| PV UFCF | ||||||||||
| SUM PV UFCF | 38,002.7 | |||||||||
| Long Term Growth Rate, % | 2.00 | |||||||||
| Free cash flow (T + 1) | 11,744 | |||||||||
| Terminal Value | 386,434 | |||||||||
| Present Terminal Value | 302,217 | |||||||||
| Enterprise Value | 340,220 | |||||||||
| Net Debt | -32,606 | |||||||||
| Equity Value | 372,826 | |||||||||
| Diluted Shares Outstanding, MM | 59 | |||||||||
| Equity Value Per Share | 6,363.08 |
What You Will Receive
- Comprehensive Seiren Financials: Access to both historical and projected data for precise valuation.
- Customizable Parameters: Adjust key metrics like WACC, tax rates, revenue growth, and capital expenditures.
- Automatic Analytics: Get dynamic calculations for intrinsic value and NPV.
- Scenario Evaluation: Analyze various scenarios to assess the future performance of Seiren Co.,Ltd. (3569T).
- User-Friendly Design: Designed for professionals, yet easy for beginners to navigate.
Key Features
- Real-Time Seiren Data: Pre-loaded with Seiren Co., Ltd.’s historical financial information and future projections.
- Customizable Parameters: Modify revenue growth rates, profit margins, discount rates, tax liabilities, and capital expenditures.
- Interactive Valuation Model: Real-time updates to Net Present Value (NPV) and intrinsic value based on user inputs.
- Scenario Analysis: Generate various forecast scenarios to evaluate different valuation possibilities.
- Intuitive User Interface: Structured and accessible design suitable for both professionals and novices.
How It Functions
- 1. Access the Template: Download and open the Excel file containing Seiren Co., Ltd.’s (3569T) preloaded data.
- 2. Modify Assumptions: Adjust essential inputs such as growth rates, WACC, and capital expenditures as needed.
- 3. Instantly View Results: The DCF model automatically calculates intrinsic value and NPV in real time.
- 4. Evaluate Scenarios: Analyze various forecasts to explore different valuation outcomes.
- 5. Proceed with Assurance: Showcase professional valuation insights to bolster your decision-making.
Why Opt for Seiren Co., Ltd. (3569T) Calculator?
- Precision: Leveraging actual Seiren financial data for reliable results.
- Adaptability: Tailored for users to experiment and adjust inputs with ease.
- Efficiency: Avoid the complexities of creating a DCF model from the ground up.
- Expert-Level: Crafted with the expertise and functionality expected at the CFO level.
- Intuitive: Designed for simplicity, making it accessible for users without extensive financial modeling skills.
Who Can Benefit from Seiren Co., Ltd. (3569T)?
- Investors: Evaluate Seiren’s market position prior to making investment decisions.
- CFOs and Financial Analysts: Optimize valuation workflows and validate financial forecasts.
- Startup Founders: Discover the valuation methodologies used for established companies like Seiren.
- Consultants: Provide expert valuation assessments and reports for your clients.
- Students and Educators: Utilize real-time data to practice and teach valuation strategies.
What the Template Contains
- Historical Data: Provides Seiren Co., Ltd.'s past financial performance and foundational forecasts.
- DCF and Levered DCF Models: Comprehensive templates for calculating the intrinsic value of Seiren Co., Ltd. (3569T).
- WACC Sheet: Pre-configured calculations for the Weighted Average Cost of Capital.
- Editable Inputs: Adjust key parameters such as growth rates, EBITDA %, and CAPEX assumptions.
- Quarterly and Annual Statements: A thorough analysis of Seiren Co., Ltd.'s financial data.
- Interactive Dashboard: Dynamically visualize valuation outcomes and forecasts.
Disclaimer
All information, articles, and product details provided on this website are for general informational and educational purposes only. We do not claim any ownership over, nor do we intend to infringe upon, any trademarks, copyrights, logos, brand names, or other intellectual property mentioned or depicted on this site. Such intellectual property remains the property of its respective owners, and any references here are made solely for identification or informational purposes, without implying any affiliation, endorsement, or partnership.
We make no representations or warranties, express or implied, regarding the accuracy, completeness, or suitability of any content or products presented. Nothing on this website should be construed as legal, tax, investment, financial, medical, or other professional advice. In addition, no part of this site—including articles or product references—constitutes a solicitation, recommendation, endorsement, advertisement, or offer to buy or sell any securities, franchises, or other financial instruments, particularly in jurisdictions where such activity would be unlawful.
All content is of a general nature and may not address the specific circumstances of any individual or entity. It is not a substitute for professional advice or services. Any actions you take based on the information provided here are strictly at your own risk. You accept full responsibility for any decisions or outcomes arising from your use of this website and agree to release us from any liability in connection with your use of, or reliance upon, the content or products found herein.