
|
Koei Tecmo Holdings Co., Ltd. (3635.T) Avaliação DCF |
Totalmente Editável: Adapte-Se Às Suas Necessidades No Excel Ou Planilhas
Design Profissional: Modelos Confiáveis E Padrão Da Indústria
Pré-Construídos Para Uso Rápido E Eficiente
Compatível com MAC/PC, totalmente desbloqueado
Não É Necessária Experiência; Fácil De Seguir
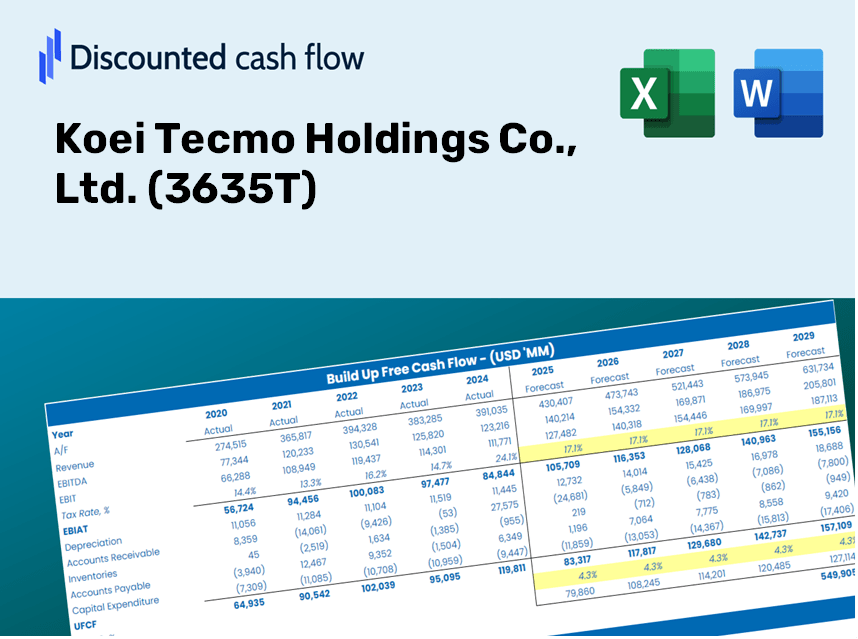
Koei Tecmo Holdings Co., Ltd. (3635.T) Bundle
Avalie a Koei Tecmo Holdings Co., Ltd. (3635T) Perspectivas financeiras com experiência! Esta calculadora (3635T) DCF fornece financeiras preenchidas e flexibilidade total para modificar o crescimento da receita, WACC, margens e outras suposições cruciais para se alinhar às suas projeções.
Discounted Cash Flow (DCF) - (USD MM)
| Year | AY1 2020 |
AY2 2021 |
AY3 2022 |
AY4 2023 |
AY5 2024 |
FY1 2025 |
FY2 2026 |
FY3 2027 |
FY4 2028 |
FY5 2029 |
|---|---|---|---|---|---|---|---|---|---|---|
| Revenue | 60,370.0 | 72,759.0 | 78,417.0 | 84,584.0 | 83,150.0 | 90,314.9 | 98,097.1 | 106,549.9 | 115,731.1 | 125,703.4 |
| Revenue Growth, % | 0 | 20.52 | 7.78 | 7.86 | -1.7 | 8.62 | 8.62 | 8.62 | 8.62 | 8.62 |
| EBITDA | 25,945.0 | 36,082.0 | 40,776.0 | 30,309.0 | 51,901.0 | 43,860.2 | 47,639.5 | 51,744.5 | 56,203.2 | 61,046.2 |
| EBITDA, % | 42.98 | 49.59 | 52 | 35.83 | 62.42 | 48.56 | 48.56 | 48.56 | 48.56 | 48.56 |
| Depreciation | 1,547.0 | 1,555.0 | 1,643.0 | 1,813.0 | 1,914.0 | 2,030.3 | 2,205.3 | 2,395.3 | 2,601.7 | 2,825.9 |
| Depreciation, % | 2.56 | 2.14 | 2.1 | 2.14 | 2.3 | 2.25 | 2.25 | 2.25 | 2.25 | 2.25 |
| EBIT | 24,398.0 | 34,527.0 | 39,133.0 | 28,496.0 | 49,987.0 | 41,829.9 | 45,434.3 | 49,349.2 | 53,601.6 | 58,220.3 |
| EBIT, % | 40.41 | 47.45 | 49.9 | 33.69 | 60.12 | 46.32 | 46.32 | 46.32 | 46.32 | 46.32 |
| Total Cash | 17,233.0 | 45,420.0 | 20,605.0 | 70,095.0 | 44,488.0 | 45,811.4 | 49,758.9 | 54,046.5 | 58,703.6 | 63,762.0 |
| Total Cash, percent | .0 | .0 | .0 | .0 | .0 | .0 | .0 | .0 | .0 | .0 |
| Account Receivables | 11,244.0 | 13,061.0 | 21,633.0 | 15,040.0 | 15,120.0 | 18,086.2 | 19,644.6 | 21,337.4 | 23,176.0 | 25,173.0 |
| Account Receivables, % | 18.63 | 17.95 | 27.59 | 17.78 | 18.18 | 20.03 | 20.03 | 20.03 | 20.03 | 20.03 |
| Inventories | 344.0 | 227.0 | 190.0 | 254.0 | 177.0 | 295.7 | 321.2 | 348.9 | 379.0 | 411.6 |
| Inventories, % | 0.56982 | 0.31199 | 0.24229 | 0.30029 | 0.21287 | 0.32745 | 0.32745 | 0.32745 | 0.32745 | 0.32745 |
| Accounts Payable | 300.0 | 520.0 | 1,169.0 | 1,046.0 | 1,238.0 | 980.4 | 1,064.9 | 1,156.7 | 1,256.4 | 1,364.6 |
| Accounts Payable, % | 0.49694 | 0.71469 | 1.49 | 1.24 | 1.49 | 1.09 | 1.09 | 1.09 | 1.09 | 1.09 |
| Capital Expenditure | -1,591.0 | -1,351.0 | -890.0 | -1,805.0 | -1,553.0 | -1,739.3 | -1,889.1 | -2,051.9 | -2,228.7 | -2,420.8 |
| Capital Expenditure, % | -2.64 | -1.86 | -1.13 | -2.13 | -1.87 | -1.93 | -1.93 | -1.93 | -1.93 | -1.93 |
| Tax Rate, % | 24.73 | 24.73 | 24.73 | 24.73 | 24.73 | 24.73 | 24.73 | 24.73 | 24.73 | 24.73 |
| EBITAT | 18,404.1 | 25,100.5 | 30,292.5 | 21,242.8 | 37,627.2 | 31,402.6 | 34,108.5 | 37,047.5 | 40,239.8 | 43,707.2 |
| Depreciation | ||||||||||
| Changes in Account Receivables | ||||||||||
| Changes in Inventories | ||||||||||
| Changes in Accounts Payable | ||||||||||
| Capital Expenditure | ||||||||||
| UFCF | 7,072.1 | 23,824.5 | 23,159.5 | 27,656.8 | 38,177.2 | 28,351.2 | 32,925.2 | 35,762.3 | 38,843.8 | 42,190.9 |
| WACC, % | 5.91 | 5.91 | 5.91 | 5.91 | 5.91 | 5.91 | 5.91 | 5.91 | 5.91 | 5.91 |
| PV UFCF | ||||||||||
| SUM PV UFCF | 148,759.3 | |||||||||
| Long Term Growth Rate, % | 3.00 | |||||||||
| Free cash flow (T + 1) | 43,457 | |||||||||
| Terminal Value | 1,493,288 | |||||||||
| Present Terminal Value | 1,120,614 | |||||||||
| Enterprise Value | 1,269,374 | |||||||||
| Net Debt | -24,034 | |||||||||
| Equity Value | 1,293,408 | |||||||||
| Diluted Shares Outstanding, MM | 331 | |||||||||
| Equity Value Per Share | 3,906.55 |
What You'll Receive
- Genuine 3635T Financial Reports: Access to both historical data and future projections for precise valuation.
- Customizable Inputs: Adjust WACC, tax rates, revenue growth, and capital expenditures to suit your analysis.
- Real-Time Calculations: Dynamic calculations for intrinsic value and NPV at your fingertips.
- Scenario Testing: Evaluate various scenarios to forecast Koei Tecmo's future performance.
- User-Friendly Design: Designed for financial professionals but easy enough for newcomers to navigate.
Key Features
- Genuine Koei Tecmo Financials: Gain access to reliable pre-loaded historical data and forecasts for future performance.
- Customizable Projection Inputs: Modify highlighted fields such as WACC, growth rates, and profit margins to fit your analysis.
- Real-time Calculations: Automatic adjustments to DCF, Net Present Value (NPV), and cash flow assessments.
- Interactive Dashboard: Clear, visually appealing charts and summaries that facilitate the interpretation of your valuation findings.
- Designed for All Users: An easy-to-navigate format tailored for investors, CFOs, and consultants alike.
How It Operates
- Download the Template: Gain immediate access to the Excel-based KOEI TECMO DCF Calculator.
- Input Your Assumptions: Modify the yellow-highlighted cells for growth projections, WACC, profit margins, and more.
- Instant Calculations: The model will automatically calculate the intrinsic value of Koei Tecmo Holdings (3635T).
- Test Scenarios: Experiment with various assumptions to assess potential changes in valuation.
- Analyze and Decide: Leverage the results to inform your investment strategies or financial assessments.
Why Choose This Calculator for Koei Tecmo Holdings Co., Ltd. (3635T)?
- All-in-One Solution: Combines DCF, WACC, and financial ratio analyses tailored for Koei Tecmo.
- Flexible Inputs: Modify the yellow-highlighted fields to explore different financial scenarios.
- In-Depth Analysis: Automatically computes Koei Tecmo's intrinsic value and Net Present Value.
- Prepopulated Information: Includes historical and projected data for reliable baseline analyses.
- High-Caliber Tool: Designed for financial analysts, investors, and business consultants focused on Koei Tecmo.
Who Should Consider This Product?
- Professional Investors: Develop comprehensive and accurate valuation models for assessing portfolios involving Koei Tecmo Holdings Co., Ltd. (3635T).
- Corporate Finance Teams: Evaluate various valuation scenarios to inform corporate strategy and decision-making.
- Consultants and Advisors: Deliver precise valuation analyses and insights to clients interested in Koei Tecmo Holdings Co., Ltd. (3635T).
- Students and Educators: Leverage real-world data to practice and teach concepts in financial modeling.
- Gaming Industry Enthusiasts: Gain a deeper understanding of how gaming companies like Koei Tecmo Holdings Co., Ltd. (3635T) are valued within the market.
Contents of the Template
- Operating and Balance Sheet Data: Pre-filled historical data and forecasts for Koei Tecmo Holdings Co., Ltd. (3635T), including metrics such as revenue, EBITDA, EBIT, and capital expenditures.
- WACC Calculation: A specialized sheet dedicated to the Weighted Average Cost of Capital (WACC), featuring essential parameters like Beta, risk-free rate, and share price.
- DCF Valuation (Unlevered and Levered): Customizable Discounted Cash Flow models that display intrinsic value alongside thorough calculations.
- Financial Statements: Pre-loaded financial statements (both annual and quarterly) to facilitate comprehensive analysis.
- Key Ratios: A collection of profitability, leverage, and efficiency ratios pertinent to Koei Tecmo Holdings Co., Ltd. (3635T).
- Dashboard and Charts: An interactive visual summary of valuation outputs and assumptions to simplify result analysis.
Disclaimer
All information, articles, and product details provided on this website are for general informational and educational purposes only. We do not claim any ownership over, nor do we intend to infringe upon, any trademarks, copyrights, logos, brand names, or other intellectual property mentioned or depicted on this site. Such intellectual property remains the property of its respective owners, and any references here are made solely for identification or informational purposes, without implying any affiliation, endorsement, or partnership.
We make no representations or warranties, express or implied, regarding the accuracy, completeness, or suitability of any content or products presented. Nothing on this website should be construed as legal, tax, investment, financial, medical, or other professional advice. In addition, no part of this site—including articles or product references—constitutes a solicitation, recommendation, endorsement, advertisement, or offer to buy or sell any securities, franchises, or other financial instruments, particularly in jurisdictions where such activity would be unlawful.
All content is of a general nature and may not address the specific circumstances of any individual or entity. It is not a substitute for professional advice or services. Any actions you take based on the information provided here are strictly at your own risk. You accept full responsibility for any decisions or outcomes arising from your use of this website and agree to release us from any liability in connection with your use of, or reliance upon, the content or products found herein.