
|
OJI Holdings Corporation (3861.T) Avaliação DCF |
Totalmente Editável: Adapte-Se Às Suas Necessidades No Excel Ou Planilhas
Design Profissional: Modelos Confiáveis E Padrão Da Indústria
Pré-Construídos Para Uso Rápido E Eficiente
Compatível com MAC/PC, totalmente desbloqueado
Não É Necessária Experiência; Fácil De Seguir
Oji Holdings Corporation (3861.T) Bundle
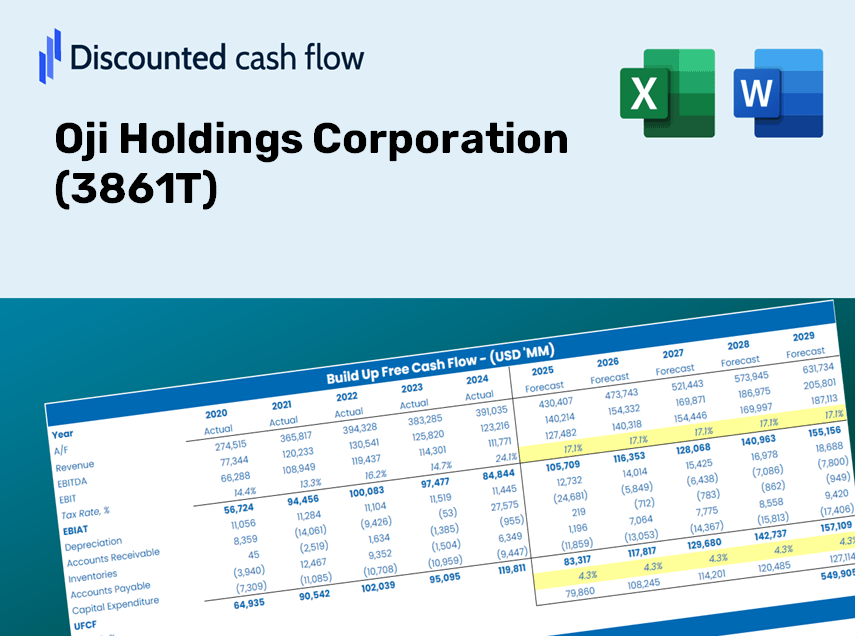
Descubra o verdadeiro valor da OJI Holdings Corporation (3861T) com nossa calculadora DCF avançada! Ajuste as principais suposições, explore vários cenários e avalie como as mudanças afetam a avaliação da OJI Holdings Corporation (3861T) - tudo dentro de um modelo conveniente do Excel.
Discounted Cash Flow (DCF) - (USD MM)
| Year | AY1 2021 |
AY2 2022 |
AY3 2023 |
AY4 2024 |
AY5 2025 |
FY1 2026 |
FY2 2027 |
FY3 2028 |
FY4 2029 |
FY5 2030 |
|---|---|---|---|---|---|---|---|---|---|---|
| Revenue | 1,358,985.0 | 1,470,161.0 | 1,706,641.0 | 1,696,268.0 | 1,849,264.0 | 2,000,339.1 | 2,163,756.2 | 2,340,523.7 | 2,531,732.1 | 2,738,561.3 |
| Revenue Growth, % | 0 | 8.18 | 16.09 | -0.6078 | 9.02 | 8.17 | 8.17 | 8.17 | 8.17 | 8.17 |
| EBITDA | 151,531.0 | 202,643.0 | 165,019.0 | 166,149.0 | 199,474.0 | 220,777.1 | 238,813.4 | 258,323.2 | 279,426.8 | 302,254.5 |
| EBITDA, % | 11.15 | 13.78 | 9.67 | 9.79 | 10.79 | 11.04 | 11.04 | 11.04 | 11.04 | 11.04 |
| Depreciation | 63,857.0 | 66,689.0 | 74,092.0 | 81,782.0 | 106,551.0 | 96,654.5 | 104,550.7 | 113,091.9 | 122,330.9 | 132,324.7 |
| Depreciation, % | 4.7 | 4.54 | 4.34 | 4.82 | 5.76 | 4.83 | 4.83 | 4.83 | 4.83 | 4.83 |
| EBIT | 87,674.0 | 135,954.0 | 90,927.0 | 84,367.0 | 92,923.0 | 124,122.5 | 134,262.7 | 145,231.2 | 157,095.9 | 169,929.8 |
| EBIT, % | 6.45 | 9.25 | 5.33 | 4.97 | 5.02 | 6.21 | 6.21 | 6.21 | 6.21 | 6.21 |
| Total Cash | 136,254.0 | 55,823.0 | 57,073.0 | 62,860.0 | 65,863.0 | 97,755.6 | 105,741.7 | 114,380.3 | 123,724.5 | 133,832.2 |
| Total Cash, percent | .0 | .0 | .0 | .0 | .0 | .0 | .0 | .0 | .0 | .0 |
| Account Receivables | 320,036.0 | 318,668.0 | 415,345.0 | 400,665.0 | 405,466.0 | 460,512.2 | 498,133.6 | 538,828.5 | 582,847.9 | 630,463.5 |
| Account Receivables, % | 23.55 | 21.68 | 24.34 | 23.62 | 21.93 | 23.02 | 23.02 | 23.02 | 23.02 | 23.02 |
| Inventories | 194,803.0 | 225,176.0 | 281,320.0 | 285,443.0 | 315,625.0 | 320,174.3 | 346,330.9 | 374,624.3 | 405,229.1 | 438,334.2 |
| Inventories, % | 14.33 | 15.32 | 16.48 | 16.83 | 17.07 | 16.01 | 16.01 | 16.01 | 16.01 | 16.01 |
| Accounts Payable | 197,950.0 | 234,650.0 | 251,176.0 | 274,659.0 | 263,763.0 | 302,849.4 | 327,590.6 | 354,353.0 | 383,301.8 | 414,615.5 |
| Accounts Payable, % | 14.57 | 15.96 | 14.72 | 16.19 | 14.26 | 15.14 | 15.14 | 15.14 | 15.14 | 15.14 |
| Capital Expenditure | -94,674.0 | -98,659.0 | -94,109.0 | -115,019.0 | -143,934.0 | -135,045.2 | -146,077.7 | -158,011.5 | -170,920.2 | -184,883.5 |
| Capital Expenditure, % | -6.97 | -6.71 | -5.51 | -6.78 | -7.78 | -6.75 | -6.75 | -6.75 | -6.75 | -6.75 |
| Tax Rate, % | 45.27 | 45.27 | 45.27 | 45.27 | 45.27 | 45.27 | 45.27 | 45.27 | 45.27 | 45.27 |
| EBITAT | 53,802.4 | 92,039.4 | 60,695.0 | 55,243.7 | 50,858.2 | 78,452.5 | 84,861.7 | 91,794.4 | 99,293.5 | 107,405.3 |
| Depreciation | ||||||||||
| Changes in Account Receivables | ||||||||||
| Changes in Inventories | ||||||||||
| Changes in Accounts Payable | ||||||||||
| Capital Expenditure | ||||||||||
| UFCF | -293,903.6 | 67,764.4 | -95,617.0 | 56,046.7 | -32,403.8 | 19,552.7 | 4,297.9 | 4,649.0 | 5,028.8 | 5,439.6 |
| WACC, % | 3.77 | 3.89 | 3.87 | 3.85 | 3.64 | 3.8 | 3.8 | 3.8 | 3.8 | 3.8 |
| PV UFCF | ||||||||||
| SUM PV UFCF | 35,827.4 | |||||||||
| Long Term Growth Rate, % | 2.00 | |||||||||
| Free cash flow (T + 1) | 5,548 | |||||||||
| Terminal Value | 307,952 | |||||||||
| Present Terminal Value | 255,541 | |||||||||
| Enterprise Value | 291,369 | |||||||||
| Net Debt | 844,959 | |||||||||
| Equity Value | -553,590 | |||||||||
| Diluted Shares Outstanding, MM | 976 | |||||||||
| Equity Value Per Share | -567.49 |
What You Will Receive
- Flexible Input Parameters: Modify key assumptions (growth %, margins, WACC) to create various scenarios with ease.
- Comprehensive Financial Data: Oji Holdings Corporation's financial metrics pre-populated to kickstart your analysis.
- Instant DCF Calculations: The template automatically computes Net Present Value (NPV) and intrinsic value for your convenience.
- Sleek and Adaptable Design: A sophisticated Excel model tailored to fit your valuation requirements.
- Designed for Investors and Analysts: Perfect for assessing projections, verifying strategies, and optimizing your time.
Key Features
- Pre-Loaded Data: Oji Holdings Corporation’s historical financial statements and pre-filled forecasts.
- Fully Adjustable Inputs: Modify WACC, tax rates, revenue growth, and EBITDA margins as needed.
- Instant Results: View Oji Holdings Corporation’s intrinsic value recalculating in real time.
- Clear Visual Outputs: Dashboard charts present valuation results and key metrics effectively.
- Built for Accuracy: A professional-grade tool designed for analysts, investors, and finance professionals.
How It Functions
- Step 1: Download the Excel file.
- Step 2: Examine Oji Holdings Corporation’s pre-filled financial data and projections.
- Step 3: Adjust key inputs such as revenue growth, WACC, and tax rates (highlighted cells).
- Step 4: Observe the DCF model recalibrating in real-time as you modify assumptions.
- Step 5: Evaluate the outputs and leverage the results for informed investment decisions regarding Oji Holdings Corporation (3861T).
Reasons to Choose This Calculator for Oji Holdings Corporation (3861T)
- Precision: Leverages accurate financial data from Oji Holdings Corporation for reliable results.
- Adaptability: Built for users to easily adjust and experiment with various inputs.
- Efficiency: Eliminate the complexity of creating a DCF model from ground zero.
- Expert-Level: Crafted with the precision and functionality expected by financial leaders.
- Intuitive: Designed to be user-friendly, making it accessible for individuals with varying levels of financial expertise.
Who Can Benefit from This Product?
- Institutional Investors: Develop comprehensive and accurate valuation models for portfolio assessments related to Oji Holdings Corporation (3861T).
- Corporate Finance Departments: Evaluate valuation scenarios to inform strategic planning for Oji Holdings Corporation (3861T).
- Financial Consultants and Advisors: Deliver precise valuation insights for clients with interests in Oji Holdings Corporation (3861T).
- Students and Educators: Utilize real-world data to enhance financial modeling skills in the context of Oji Holdings Corporation (3861T).
- Industry Enthusiasts: Gain insights into how companies like Oji Holdings Corporation (3861T) are valued in the financial markets.
What the Template Includes
- Pre-Filled Data: Contains Oji Holdings Corporation’s historical financial data and projections.
- Discounted Cash Flow Model: An editable DCF valuation model featuring automated calculations.
- Weighted Average Cost of Capital (WACC): A specific sheet dedicated to calculating WACC using user-defined inputs.
- Key Financial Ratios: Review Oji Holdings’ profitability, operational efficiency, and financial leverage.
- Customizable Inputs: Easily modify parameters such as revenue growth, profit margins, and tax rates.
- Clear Dashboard: Visualizations and tables that summarize essential valuation outcomes.
Disclaimer
All information, articles, and product details provided on this website are for general informational and educational purposes only. We do not claim any ownership over, nor do we intend to infringe upon, any trademarks, copyrights, logos, brand names, or other intellectual property mentioned or depicted on this site. Such intellectual property remains the property of its respective owners, and any references here are made solely for identification or informational purposes, without implying any affiliation, endorsement, or partnership.
We make no representations or warranties, express or implied, regarding the accuracy, completeness, or suitability of any content or products presented. Nothing on this website should be construed as legal, tax, investment, financial, medical, or other professional advice. In addition, no part of this site—including articles or product references—constitutes a solicitation, recommendation, endorsement, advertisement, or offer to buy or sell any securities, franchises, or other financial instruments, particularly in jurisdictions where such activity would be unlawful.
All content is of a general nature and may not address the specific circumstances of any individual or entity. It is not a substitute for professional advice or services. Any actions you take based on the information provided here are strictly at your own risk. You accept full responsibility for any decisions or outcomes arising from your use of this website and agree to release us from any liability in connection with your use of, or reliance upon, the content or products found herein.