
|
A United Laboratories International Holdings Limited (3933.HK) Avaliação DCF |
Totalmente Editável: Adapte-Se Às Suas Necessidades No Excel Ou Planilhas
Design Profissional: Modelos Confiáveis E Padrão Da Indústria
Pré-Construídos Para Uso Rápido E Eficiente
Compatível com MAC/PC, totalmente desbloqueado
Não É Necessária Experiência; Fácil De Seguir
The United Laboratories International Holdings Limited (3933.HK) Bundle
Simplifique a avaliação limitada da United Laboratories International Holdings com esta calculadora DCF personalizável! Com o Real (3933HK) financeiras e insumos de previsão ajustáveis, você pode testar o valor justo dos cenários e descobrir (3933HK) em minutos.
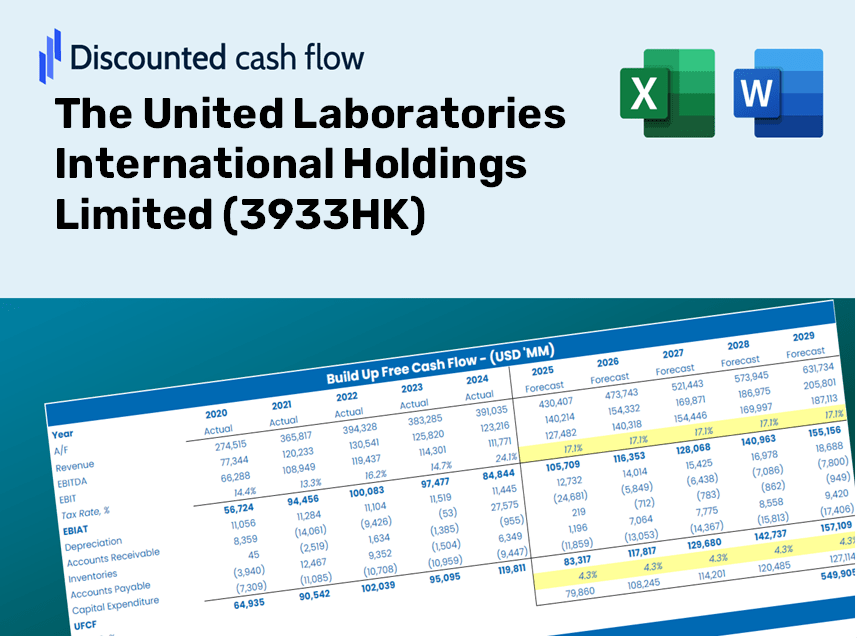
Discounted Cash Flow (DCF) - (USD MM)
| Year | AY1 2020 |
AY2 2021 |
AY3 2022 |
AY4 2023 |
AY5 2024 |
FY1 2025 |
FY2 2026 |
FY3 2027 |
FY4 2028 |
FY5 2029 |
|---|---|---|---|---|---|---|---|---|---|---|
| Revenue | 9,582.2 | 10,599.1 | 12,380.4 | 15,008.1 | 15,028.9 | 15,372.6 | 15,724.3 | 16,083.9 | 16,451.8 | 16,828.2 |
| Revenue Growth, % | 0 | 10.61 | 16.81 | 21.22 | 0.13871 | 2.29 | 2.29 | 2.29 | 2.29 | 2.29 |
| EBITDA | 1,995.6 | 2,160.3 | 2,773.0 | 4,343.7 | 3,660.7 | 3,594.4 | 3,676.6 | 3,760.7 | 3,846.7 | 3,934.7 |
| EBITDA, % | 20.83 | 20.38 | 22.4 | 28.94 | 24.36 | 23.38 | 23.38 | 23.38 | 23.38 | 23.38 |
| Depreciation | 651.4 | 651.1 | 572.0 | 617.9 | 587.7 | 786.7 | 804.7 | 823.1 | 841.9 | 861.2 |
| Depreciation, % | 6.8 | 6.14 | 4.62 | 4.12 | 3.91 | 5.12 | 5.12 | 5.12 | 5.12 | 5.12 |
| EBIT | 1,344.2 | 1,509.2 | 2,201.0 | 3,725.9 | 3,073.0 | 2,807.6 | 2,871.9 | 2,937.5 | 3,004.7 | 3,073.5 |
| EBIT, % | 14.03 | 14.24 | 17.78 | 24.83 | 20.45 | 18.26 | 18.26 | 18.26 | 18.26 | 18.26 |
| Total Cash | 3,273.4 | 3,638.5 | 5,180.9 | 4,655.4 | 6,914.1 | 5,760.5 | 5,892.2 | 6,027.0 | 6,164.9 | 6,305.9 |
| Total Cash, percent | .0 | .0 | .0 | .0 | .0 | .0 | .0 | .0 | .0 | .0 |
| Account Receivables | 3,225.4 | 3,739.7 | 4,888.9 | 6,403.8 | 6,593.5 | 5,994.5 | 6,131.7 | 6,271.9 | 6,415.4 | 6,562.1 |
| Account Receivables, % | 33.66 | 35.28 | 39.49 | 42.67 | 43.87 | 38.99 | 38.99 | 38.99 | 38.99 | 38.99 |
| Inventories | 1,560.4 | 2,189.0 | 2,363.3 | 2,445.1 | 2,658.8 | 2,767.4 | 2,830.7 | 2,895.4 | 2,961.6 | 3,029.4 |
| Inventories, % | 16.28 | 20.65 | 19.09 | 16.29 | 17.69 | 18 | 18 | 18 | 18 | 18 |
| Accounts Payable | 2,487.7 | 3,507.0 | 3,886.9 | 4,609.6 | 4,560.4 | 4,658.0 | 4,764.6 | 4,873.5 | 4,985.0 | 5,099.0 |
| Accounts Payable, % | 25.96 | 33.09 | 31.4 | 30.71 | 30.34 | 30.3 | 30.3 | 30.3 | 30.3 | 30.3 |
| Capital Expenditure | -579.7 | -526.7 | -851.5 | -1,596.9 | -2,042.9 | -1,295.3 | -1,324.9 | -1,355.2 | -1,386.2 | -1,418.0 |
| Capital Expenditure, % | -6.05 | -4.97 | -6.88 | -10.64 | -13.59 | -8.43 | -8.43 | -8.43 | -8.43 | -8.43 |
| Tax Rate, % | 19.13 | 19.13 | 19.13 | 19.13 | 19.13 | 19.13 | 19.13 | 19.13 | 19.13 | 19.13 |
| EBITAT | 1,071.0 | 1,240.0 | 1,734.2 | 3,009.7 | 2,485.1 | 2,258.9 | 2,310.5 | 2,363.4 | 2,417.4 | 2,472.7 |
| Depreciation | ||||||||||
| Changes in Account Receivables | ||||||||||
| Changes in Inventories | ||||||||||
| Changes in Accounts Payable | ||||||||||
| Capital Expenditure | ||||||||||
| UFCF | -1,155.4 | 1,240.8 | 510.9 | 1,156.8 | 577.3 | 2,338.3 | 1,696.4 | 1,735.2 | 1,774.9 | 1,815.5 |
| WACC, % | 4.45 | 4.47 | 4.45 | 4.46 | 4.46 | 4.46 | 4.46 | 4.46 | 4.46 | 4.46 |
| PV UFCF | ||||||||||
| SUM PV UFCF | 8,266.5 | |||||||||
| Long Term Growth Rate, % | 0.50 | |||||||||
| Free cash flow (T + 1) | 1,825 | |||||||||
| Terminal Value | 46,111 | |||||||||
| Present Terminal Value | 37,078 | |||||||||
| Enterprise Value | 45,345 | |||||||||
| Net Debt | -3,467 | |||||||||
| Equity Value | 48,812 | |||||||||
| Diluted Shares Outstanding, MM | 1,817 | |||||||||
| Equity Value Per Share | 26.87 |
What You Will Receive
- Pre-Loaded Financial Model: Utilize the actual data of The United Laboratories International Holdings Limited for accurate DCF valuation.
- Comprehensive Forecast Control: Modify revenue growth, margins, WACC, and other essential parameters at your discretion.
- Real-Time Calculations: Automated updates provide immediate feedback as you adjust inputs.
- Professional-Grade Template: An expertly crafted Excel file designed for high-quality valuation.
- Adaptable and Reusable: Engineered for versatility, enabling multiple uses for in-depth forecasts.
Key Features
- 🔍 Real-Life (3933HK) Financials: Access pre-filled historical and projected data for United Laboratories International Holdings Limited.
- ✏️ Fully Customizable Inputs: Modify all essential parameters (yellow cells) such as WACC, growth %, and tax rates as needed.
- 📊 Professional DCF Valuation: Utilize built-in formulas to compute the intrinsic value of United Laboratories using the Discounted Cash Flow method.
- ⚡ Instant Results: See United Laboratories’ valuation updates in real-time after adjustments are made.
- Scenario Analysis: Evaluate and compare different outcomes based on various financial assumptions side-by-side.
How It Functions
- Step 1: Download the Excel file.
- Step 2: Examine the pre-populated data for The United Laboratories International Holdings Limited (3933HK).
- Step 3: Modify key assumptions (highlighted in yellow) according to your insights.
- Step 4: Observe the automatic recalculations for the intrinsic value of The United Laboratories International Holdings Limited (3933HK).
- Step 5: Utilize the results for your investment strategies or reporting needs.
Why Opt for This Calculator?
- All-in-One Solution: Features DCF, WACC, and various financial ratio analyses seamlessly integrated.
- Adjustable Parameters: Easily modify the yellow-highlighted fields to explore different scenarios.
- In-Depth Analysis: Automatically computes the intrinsic value and Net Present Value for United Laboratories International Holdings Limited (3933HK).
- Pre-Loaded Information: Access to historical and projected data to establish reliable baselines.
- High-Quality Standards: Perfect for financial analysts, investors, and business consultants alike.
Who Should Use This Product?
- Individual Investors: Make informed decisions about buying or selling United Laboratories International Holdings Limited (3933HK) stock.
- Financial Analysts: Streamline valuation processes with ready-to-use financial models for United Laboratories International Holdings Limited (3933HK).
- Consultants: Provide clients with professional valuation insights on United Laboratories International Holdings Limited (3933HK) quickly and accurately.
- Business Owners: Gain an understanding of how large companies like United Laboratories International Holdings Limited (3933HK) are valued to inform your own business strategy.
- Finance Students: Explore valuation techniques using real-world data and scenarios related to United Laboratories International Holdings Limited (3933HK).
Contents of the Template
- Pre-Filled Data: Contains The United Laboratories International Holdings Limited’s historical financials and projections.
- Discounted Cash Flow Model: Customizable DCF valuation model with automatic calculations.
- Weighted Average Cost of Capital (WACC): A dedicated sheet for calculating WACC using tailored inputs.
- Key Financial Ratios: Evaluate The United Laboratories International Holdings Limited’s profitability, efficiency, and leverage.
- Customizable Inputs: Easily modify revenue growth, margins, and tax rates.
- Clear Dashboard: Visuals and tables summarizing essential valuation outcomes.
Disclaimer
All information, articles, and product details provided on this website are for general informational and educational purposes only. We do not claim any ownership over, nor do we intend to infringe upon, any trademarks, copyrights, logos, brand names, or other intellectual property mentioned or depicted on this site. Such intellectual property remains the property of its respective owners, and any references here are made solely for identification or informational purposes, without implying any affiliation, endorsement, or partnership.
We make no representations or warranties, express or implied, regarding the accuracy, completeness, or suitability of any content or products presented. Nothing on this website should be construed as legal, tax, investment, financial, medical, or other professional advice. In addition, no part of this site—including articles or product references—constitutes a solicitation, recommendation, endorsement, advertisement, or offer to buy or sell any securities, franchises, or other financial instruments, particularly in jurisdictions where such activity would be unlawful.
All content is of a general nature and may not address the specific circumstances of any individual or entity. It is not a substitute for professional advice or services. Any actions you take based on the information provided here are strictly at your own risk. You accept full responsibility for any decisions or outcomes arising from your use of this website and agree to release us from any liability in connection with your use of, or reliance upon, the content or products found herein.