
|
Rengo Co., Ltd. (3941.T) Avaliação DCF |
Totalmente Editável: Adapte-Se Às Suas Necessidades No Excel Ou Planilhas
Design Profissional: Modelos Confiáveis E Padrão Da Indústria
Pré-Construídos Para Uso Rápido E Eficiente
Compatível com MAC/PC, totalmente desbloqueado
Não É Necessária Experiência; Fácil De Seguir
Rengo Co., Ltd. (3941.T) Bundle
Descubra o verdadeiro potencial da Rengo Co., Ltd. (3941T) com nossa calculadora DCF avançada! Ajuste as principais suposições, explore vários cenários e avalie como as mudanças afetam a avaliação da Rengo Co., Ltd. (3941T) - tudo dentro de um único modelo do Excel.
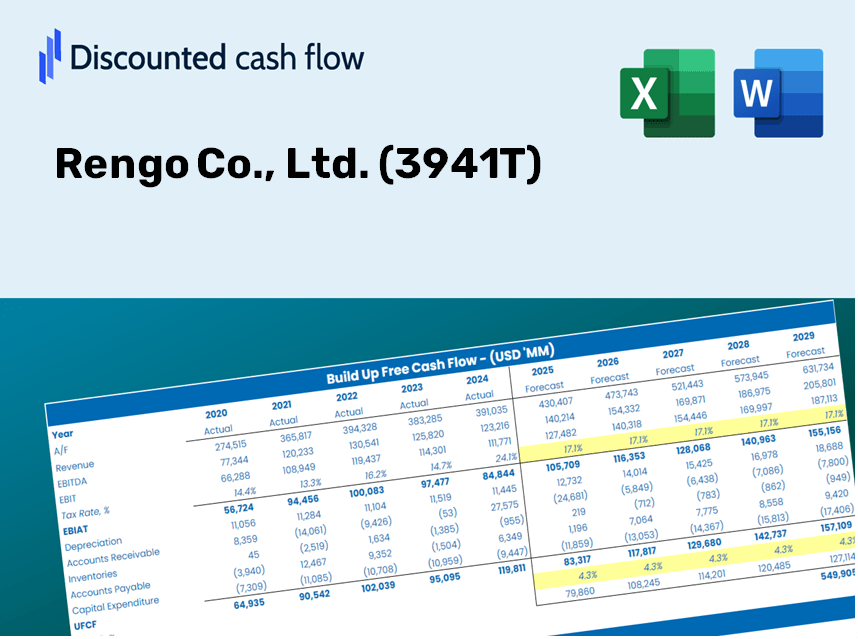
Discounted Cash Flow (DCF) - (USD MM)
| Year | AY1 2020 |
AY2 2021 |
AY3 2022 |
AY4 2023 |
AY5 2024 |
FY1 2025 |
FY2 2026 |
FY3 2027 |
FY4 2028 |
FY5 2029 |
|---|---|---|---|---|---|---|---|---|---|---|
| Revenue | 680,714.0 | 746,926.0 | 846,080.0 | 900,791.0 | 993,251.0 | 1,016,080.6 | 1,039,434.9 | 1,063,325.9 | 1,087,766.2 | 1,112,768.1 |
| Revenue Growth, % | 0 | 9.73 | 13.27 | 6.47 | 10.26 | 2.3 | 2.3 | 2.3 | 2.3 | 2.3 |
| EBITDA | 82,950.0 | 86,956.0 | 80,536.0 | 105,744.0 | 106,743.0 | 113,459.9 | 116,067.8 | 118,735.6 | 121,464.7 | 124,256.5 |
| EBITDA, % | 12.19 | 11.64 | 9.52 | 11.74 | 10.75 | 11.17 | 11.17 | 11.17 | 11.17 | 11.17 |
| Depreciation | 40,074.0 | 43,913.0 | 47,601.0 | 52,198.0 | 59,626.0 | 59,318.9 | 60,682.4 | 62,077.1 | 63,504.0 | 64,963.6 |
| Depreciation, % | 5.89 | 5.88 | 5.63 | 5.79 | 6 | 5.84 | 5.84 | 5.84 | 5.84 | 5.84 |
| EBIT | 42,876.0 | 43,043.0 | 32,935.0 | 53,546.0 | 47,117.0 | 54,141.0 | 55,385.4 | 56,658.4 | 57,960.7 | 59,292.9 |
| EBIT, % | 6.3 | 5.76 | 3.89 | 5.94 | 4.74 | 5.33 | 5.33 | 5.33 | 5.33 | 5.33 |
| Total Cash | 52,380.0 | 60,308.0 | 72,532.0 | 117,588.0 | 80,563.0 | 92,476.8 | 94,602.4 | 96,776.8 | 99,001.2 | 101,276.7 |
| Total Cash, percent | .0 | .0 | .0 | .0 | .0 | .0 | .0 | .0 | .0 | .0 |
| Account Receivables | 196,536.0 | 213,965.0 | 241,924.0 | 270,426.0 | 269,250.0 | 291,087.8 | 297,778.4 | 304,622.7 | 311,624.4 | 318,787.0 |
| Account Receivables, % | 28.87 | 28.65 | 28.59 | 30.02 | 27.11 | 28.65 | 28.65 | 28.65 | 28.65 | 28.65 |
| Inventories | 51,807.0 | 66,236.0 | 87,253.0 | 85,103.0 | 104,673.0 | 95,058.7 | 97,243.6 | 99,478.7 | 101,765.1 | 104,104.2 |
| Inventories, % | 7.61 | 8.87 | 10.31 | 9.45 | 10.54 | 9.36 | 9.36 | 9.36 | 9.36 | 9.36 |
| Accounts Payable | 112,897.0 | 129,484.0 | 143,950.0 | 152,857.0 | 155,252.0 | 169,755.2 | 173,657.0 | 177,648.4 | 181,731.6 | 185,908.7 |
| Accounts Payable, % | 16.59 | 17.34 | 17.01 | 16.97 | 15.63 | 16.71 | 16.71 | 16.71 | 16.71 | 16.71 |
| Capital Expenditure | -41,008.0 | -47,955.0 | -44,195.0 | -65,035.0 | -96,121.0 | -70,242.2 | -71,856.7 | -73,508.3 | -75,197.8 | -76,926.2 |
| Capital Expenditure, % | -6.02 | -6.42 | -5.22 | -7.22 | -9.68 | -6.91 | -6.91 | -6.91 | -6.91 | -6.91 |
| Tax Rate, % | 32.27 | 32.27 | 32.27 | 32.27 | 32.27 | 32.27 | 32.27 | 32.27 | 32.27 | 32.27 |
| EBITAT | 29,759.5 | 29,280.5 | 21,800.5 | 35,163.2 | 31,912.0 | 36,493.8 | 37,332.6 | 38,190.6 | 39,068.4 | 39,966.4 |
| Depreciation | ||||||||||
| Changes in Account Receivables | ||||||||||
| Changes in Inventories | ||||||||||
| Changes in Accounts Payable | ||||||||||
| Capital Expenditure | ||||||||||
| UFCF | -106,620.5 | 9,967.5 | -9,303.5 | 4,881.2 | -20,582.0 | 27,850.2 | 21,184.6 | 21,671.5 | 22,169.6 | 22,679.2 |
| WACC, % | 3.22 | 3.19 | 3.15 | 3.13 | 3.18 | 3.17 | 3.17 | 3.17 | 3.17 | 3.17 |
| PV UFCF | ||||||||||
| SUM PV UFCF | 105,590.9 | |||||||||
| Long Term Growth Rate, % | 2.00 | |||||||||
| Free cash flow (T + 1) | 23,133 | |||||||||
| Terminal Value | 1,970,553 | |||||||||
| Present Terminal Value | 1,685,537 | |||||||||
| Enterprise Value | 1,791,128 | |||||||||
| Net Debt | 367,964 | |||||||||
| Equity Value | 1,423,164 | |||||||||
| Diluted Shares Outstanding, MM | 248 | |||||||||
| Equity Value Per Share | 5,743.01 |
What You Will Receive
- Adjustable Forecast Inputs: Effortlessly modify key assumptions (growth %, margins, WACC) to develop various scenarios.
- Real-World Data: Rengo Co., Ltd.'s (3941T) financial data pre-populated to kickstart your analysis.
- Automatic DCF Outputs: The template computes Net Present Value (NPV) and intrinsic value automatically.
- Customizable & Professional: A sleek Excel model tailored to meet your valuation requirements.
- Designed for Analysts and Investors: Perfect for evaluating projections, confirming strategies, and enhancing efficiency.
Key Features
- Comprehensive Rengo Data: Pre-loaded with Rengo Co., Ltd.'s historical financial performance and future projections.
- Fully Customizable Parameters: Modify revenue growth rates, profit margins, WACC, tax rates, and capital expenditures to suit your needs.
- Dynamic Valuation Framework: Automatic recalibration of Net Present Value (NPV) and intrinsic value based on your customized inputs.
- Scenario Analysis: Develop various forecasting scenarios to evaluate different valuation results.
- User-Centric Interface: Intuitive, organized design suitable for both professionals and newcomers.
How It Works
- Download: Obtain the pre-prepared Excel file containing Rengo Co., Ltd.'s (3941T) financial data.
- Customize: Modify projections such as revenue growth, EBITDA %, and WACC to suit your analysis.
- Update Automatically: The intrinsic value and NPV calculations refresh in real-time as you make changes.
- Test Scenarios: Develop various forecasts to evaluate and compare different potential outcomes instantly.
- Make Decisions: Leverage the valuation insights to inform your investment strategy regarding Rengo Co., Ltd. (3941T).
Why Select This Calculator for Rengo Co., Ltd. (3941T)?
- Designed for Experts: A sophisticated tool utilized by financial analysts, CFOs, and business consultants.
- Accurate Data: Rengo Co., Ltd.'s historical and projected financials are preloaded for precise calculations.
- Flexible Scenario Analysis: Effortlessly test various forecasts and assumptions.
- Concise Results: Instantly computes intrinsic value, NPV, and essential financial metrics.
- User-Friendly: Comprehensive step-by-step guidelines to assist you throughout the process.
Who Should Use Rengo Co., Ltd. (3941T)?
- Individual Investors: Gain insights to make informed decisions about buying or selling Rengo Co., Ltd. (3941T) shares.
- Financial Analysts: Enhance valuation processes with easily accessible financial models tailored for Rengo Co., Ltd. (3941T).
- Consultants: Provide accurate and timely valuation insights regarding Rengo Co., Ltd. (3941T) to your clients.
- Business Owners: Learn how the valuation of established companies like Rengo Co., Ltd. (3941T) can inform and shape your own business strategies.
- Finance Students: Explore valuation techniques using real-world data, specifically focusing on Rengo Co., Ltd. (3941T).
Contents of the Template
- Preloaded Rengo Co., Ltd. Data: Historical and projected financial figures, including revenue, EBIT, and capital expenditures.
- DCF and WACC Models: Professional-grade spreadsheets designed for determining intrinsic value and Weighted Average Cost of Capital.
- Editable Inputs: Cells highlighted in yellow for modifying revenue growth, tax rates, and discount rates.
- Financial Statements: Detailed annual and quarterly financials for thorough analysis.
- Key Ratios: Ratios for profitability, leverage, and efficiency to assess performance.
- Dashboard and Charts: Visual representations of valuation results and underlying assumptions.
Disclaimer
All information, articles, and product details provided on this website are for general informational and educational purposes only. We do not claim any ownership over, nor do we intend to infringe upon, any trademarks, copyrights, logos, brand names, or other intellectual property mentioned or depicted on this site. Such intellectual property remains the property of its respective owners, and any references here are made solely for identification or informational purposes, without implying any affiliation, endorsement, or partnership.
We make no representations or warranties, express or implied, regarding the accuracy, completeness, or suitability of any content or products presented. Nothing on this website should be construed as legal, tax, investment, financial, medical, or other professional advice. In addition, no part of this site—including articles or product references—constitutes a solicitation, recommendation, endorsement, advertisement, or offer to buy or sell any securities, franchises, or other financial instruments, particularly in jurisdictions where such activity would be unlawful.
All content is of a general nature and may not address the specific circumstances of any individual or entity. It is not a substitute for professional advice or services. Any actions you take based on the information provided here are strictly at your own risk. You accept full responsibility for any decisions or outcomes arising from your use of this website and agree to release us from any liability in connection with your use of, or reliance upon, the content or products found herein.