|
Sinal ferroviário da China & Comunicação Corporation Limited (3969.HK) Avaliação DCF |
Totalmente Editável: Adapte-Se Às Suas Necessidades No Excel Ou Planilhas
Design Profissional: Modelos Confiáveis E Padrão Da Indústria
Pré-Construídos Para Uso Rápido E Eficiente
Compatível com MAC/PC, totalmente desbloqueado
Não É Necessária Experiência; Fácil De Seguir
China Railway Signal & Communication Corporation Limited (3969.HK) Bundle
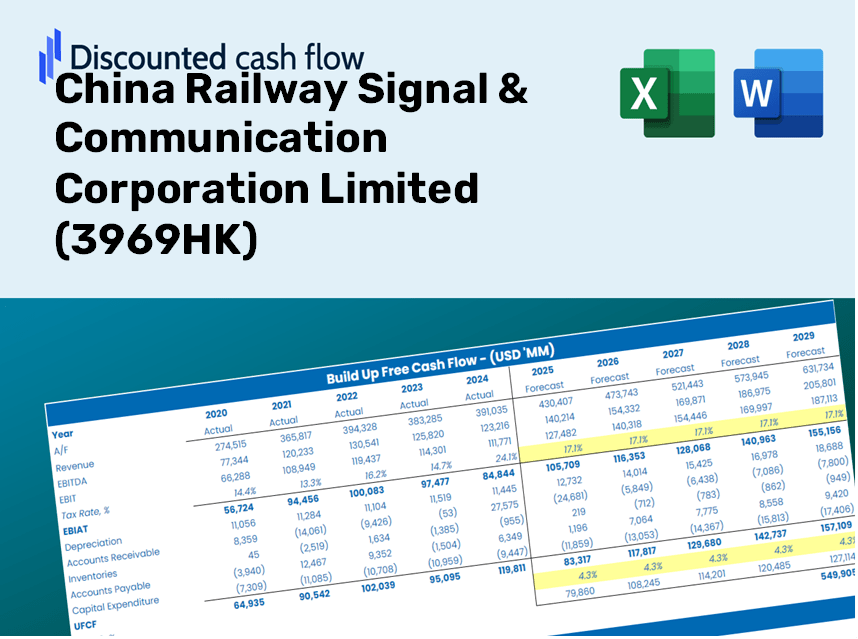
Aprimore suas opções de investimento com a calculadora DCF (3969HK)! Explore dados financeiros autênticos para o sinal ferroviário da China & A Communication Corporation Limited, ajusta as previsões e despesas do crescimento e observa instantaneamente como essas modificações afetam o valor intrínseco de (3969HK).
Discounted Cash Flow (DCF) - (USD MM)
| Year | AY1 2020 |
AY2 2021 |
AY3 2022 |
AY4 2023 |
AY5 2024 |
FY1 2025 |
FY2 2026 |
FY3 2027 |
FY4 2028 |
FY5 2029 |
|---|---|---|---|---|---|---|---|---|---|---|
| Revenue | 43,871.1 | 41,940.0 | 43,957.1 | 40,457.3 | 35,505.2 | 33,748.2 | 32,078.1 | 30,490.7 | 28,981.8 | 27,547.6 |
| Revenue Growth, % | 0 | -4.4 | 4.81 | -7.96 | -12.24 | -4.95 | -4.95 | -4.95 | -4.95 | -4.95 |
| EBITDA | 6,213.4 | 5,523.1 | 5,627.9 | 5,510.7 | 5,513.1 | 4,676.4 | 4,445.0 | 4,225.0 | 4,015.9 | 3,817.2 |
| EBITDA, % | 14.16 | 13.17 | 12.8 | 13.62 | 15.53 | 13.86 | 13.86 | 13.86 | 13.86 | 13.86 |
| Depreciation | 660.6 | 746.9 | 321.0 | 298.6 | 282.8 | 374.7 | 356.2 | 338.5 | 321.8 | 305.9 |
| Depreciation, % | 1.51 | 1.78 | 0.73036 | 0.73816 | 0.7965 | 1.11 | 1.11 | 1.11 | 1.11 | 1.11 |
| EBIT | 5,552.9 | 4,776.1 | 5,306.9 | 5,212.1 | 5,230.3 | 4,301.7 | 4,088.8 | 3,886.5 | 3,694.2 | 3,511.3 |
| EBIT, % | 12.66 | 11.39 | 12.07 | 12.88 | 14.73 | 12.75 | 12.75 | 12.75 | 12.75 | 12.75 |
| Total Cash | 24,864.0 | 25,128.6 | 24,289.7 | 24,681.9 | 24,685.1 | 20,409.6 | 19,399.6 | 18,439.6 | 17,527.1 | 16,659.8 |
| Total Cash, percent | .0 | .0 | .0 | .0 | .0 | .0 | .0 | .0 | .0 | .0 |
| Account Receivables | 61,846.1 | 64,853.5 | 70,033.4 | 69,043.8 | 68,814.0 | 33,748.2 | 32,078.1 | 30,490.7 | 28,981.8 | 27,547.6 |
| Account Receivables, % | 140.97 | 154.63 | 159.32 | 170.66 | 193.81 | 100 | 100 | 100 | 100 | 100 |
| Inventories | 2,721.6 | 2,725.5 | 2,600.9 | 3,492.6 | 3,776.4 | 2,557.3 | 2,430.8 | 2,310.5 | 2,196.1 | 2,087.5 |
| Inventories, % | 6.2 | 6.5 | 5.92 | 8.63 | 10.64 | 7.58 | 7.58 | 7.58 | 7.58 | 7.58 |
| Accounts Payable | 48,880.3 | 50,792.9 | 57,017.6 | 54,307.4 | 46,726.2 | 33,748.2 | 32,078.1 | 30,490.7 | 28,981.8 | 27,547.6 |
| Accounts Payable, % | 111.42 | 121.11 | 129.71 | 134.23 | 131.6 | 100 | 100 | 100 | 100 | 100 |
| Capital Expenditure | -1,912.3 | -950.7 | -774.1 | -744.2 | -939.1 | -868.8 | -825.8 | -784.9 | -746.1 | -709.1 |
| Capital Expenditure, % | -4.36 | -2.27 | -1.76 | -1.84 | -2.65 | -2.57 | -2.57 | -2.57 | -2.57 | -2.57 |
| Tax Rate, % | 26.13 | 26.13 | 26.13 | 26.13 | 26.13 | 26.13 | 26.13 | 26.13 | 26.13 | 26.13 |
| EBITAT | 4,211.1 | 3,659.5 | 4,065.9 | 3,864.2 | 3,863.7 | 3,244.2 | 3,083.7 | 2,931.1 | 2,786.0 | 2,648.1 |
| Depreciation | ||||||||||
| Changes in Account Receivables | ||||||||||
| Changes in Inventories | ||||||||||
| Changes in Accounts Payable | ||||||||||
| Capital Expenditure | ||||||||||
| UFCF | -12,728.0 | 2,357.1 | 4,782.3 | 806.3 | -4,427.8 | 26,057.1 | 2,740.6 | 2,605.0 | 2,476.1 | 2,353.6 |
| WACC, % | 5.02 | 5.03 | 5.03 | 5.01 | 5.01 | 5.02 | 5.02 | 5.02 | 5.02 | 5.02 |
| PV UFCF | ||||||||||
| SUM PV UFCF | 33,422.5 | |||||||||
| Long Term Growth Rate, % | 2.00 | |||||||||
| Free cash flow (T + 1) | 2,401 | |||||||||
| Terminal Value | 79,454 | |||||||||
| Present Terminal Value | 62,191 | |||||||||
| Enterprise Value | 95,614 | |||||||||
| Net Debt | -18,691 | |||||||||
| Equity Value | 114,305 | |||||||||
| Diluted Shares Outstanding, MM | 10,590 | |||||||||
| Equity Value Per Share | 10.79 |
What You Will Receive
- Authentic 3969HK Financial Data: Pre-populated with China Railway Signal & Communication Corporation Limited's historical and projected figures for accurate analysis.
- Completely Customizable Template: Easily adjust key metrics such as revenue growth, WACC, and EBITDA percentage.
- Instant Calculations: Watch the intrinsic value of 3969HK update in real-time as you make modifications.
- Expert Valuation Tool: Tailored for investors, analysts, and consultants aiming for precise DCF outcomes.
- Intuitive Layout: Clear structure and straightforward instructions suitable for all skill levels.
Key Features
- Pre-Loaded Data: Historical financial statements and pre-filled forecasts for China Railway Signal & Communication Corporation Limited (3969HK).
- Fully Adjustable Inputs: Customize WACC, tax rates, revenue growth, and EBITDA margins as needed.
- Instant Results: Observe the intrinsic value of China Railway Signal & Communication Corporation Limited (3969HK) recalculating in real time.
- Clear Visual Outputs: Dashboard charts illustrate valuation results and essential metrics.
- Built for Accuracy: A professional-grade tool designed for analysts, investors, and finance professionals.
How It Works
- Step 1: Download the prebuilt Excel template featuring data for China Railway Signal & Communication Corporation Limited (3969HK).
- Step 2: Review the pre-filled sheets to familiarize yourself with the essential metrics.
- Step 3: Modify projections and assumptions in the editable yellow cells (WACC, growth, margins).
- Step 4: Instantly view the updated results, including the intrinsic value of China Railway Signal & Communication Corporation Limited (3969HK).
- Step 5: Use the outputs to make informed investment choices or create detailed reports.
Why Opt for This Calculator?
- Precision: Utilizes actual financial data from China Railway Signal & Communication Corporation Limited (3969HK) for reliable results.
- Versatility: Tailored for users to easily experiment with and adjust parameters.
- Efficiency: Eliminate the need to create a DCF model from the ground up.
- Expert-Level: Crafted with the accuracy and usability required by finance professionals.
- Accessible: Intuitive interface that is simple enough for users without extensive financial modeling backgrounds.
Who Should Utilize This Product?
- Investors: Accurately assess the fair value of China Railway Signal & Communication Corporation Limited (3969HK) before making investment choices.
- CFOs: Utilize a high-quality DCF model for thorough financial reporting and analysis.
- Consultants: Easily customize the template for client valuation reports.
- Entrepreneurs: Acquire insights into financial modeling practices employed by leading companies.
- Educators: Apply it as a teaching resource to illustrate valuation techniques.
Contents of the Template
- Operating and Balance Sheet Data: Pre-loaded historical data and forecasts for China Railway Signal & Communication Corporation Limited (3969HK), including revenue, EBITDA, EBIT, and capital expenditures.
- WACC Calculation: A specific sheet dedicated to calculating the Weighted Average Cost of Capital (WACC), featuring parameters such as Beta, risk-free rate, and share price.
- DCF Valuation (Unlevered and Levered): Customizable Discounted Cash Flow models that display intrinsic value alongside comprehensive calculations.
- Financial Statements: Pre-populated financial statements (annual and quarterly) to facilitate thorough analysis.
- Key Ratios: Incorporates profitability, leverage, and efficiency ratios relevant to China Railway Signal & Communication Corporation Limited (3969HK).
- Dashboard and Charts: Visual representation of valuation outputs and assumptions for easier result analysis.
Disclaimer
All information, articles, and product details provided on this website are for general informational and educational purposes only. We do not claim any ownership over, nor do we intend to infringe upon, any trademarks, copyrights, logos, brand names, or other intellectual property mentioned or depicted on this site. Such intellectual property remains the property of its respective owners, and any references here are made solely for identification or informational purposes, without implying any affiliation, endorsement, or partnership.
We make no representations or warranties, express or implied, regarding the accuracy, completeness, or suitability of any content or products presented. Nothing on this website should be construed as legal, tax, investment, financial, medical, or other professional advice. In addition, no part of this site—including articles or product references—constitutes a solicitation, recommendation, endorsement, advertisement, or offer to buy or sell any securities, franchises, or other financial instruments, particularly in jurisdictions where such activity would be unlawful.
All content is of a general nature and may not address the specific circumstances of any individual or entity. It is not a substitute for professional advice or services. Any actions you take based on the information provided here are strictly at your own risk. You accept full responsibility for any decisions or outcomes arising from your use of this website and agree to release us from any liability in connection with your use of, or reliance upon, the content or products found herein.