
|
Bosideng International Holdings Limited (3998.HK) DCF Valuation |
Totalmente Editável: Adapte-Se Às Suas Necessidades No Excel Ou Planilhas
Design Profissional: Modelos Confiáveis E Padrão Da Indústria
Pré-Construídos Para Uso Rápido E Eficiente
Compatível com MAC/PC, totalmente desbloqueado
Não É Necessária Experiência; Fácil De Seguir
Bosideng International Holdings Limited (3998.HK) Bundle
Explore the financial prospects of Bosideng International Holdings Limited (3998HK) with our user-friendly DCF Calculator! Enter your predictions for growth, margins, and expenses to calculate the intrinsic value of Bosideng International Holdings Limited (3998HK) and enhance your investment approach.
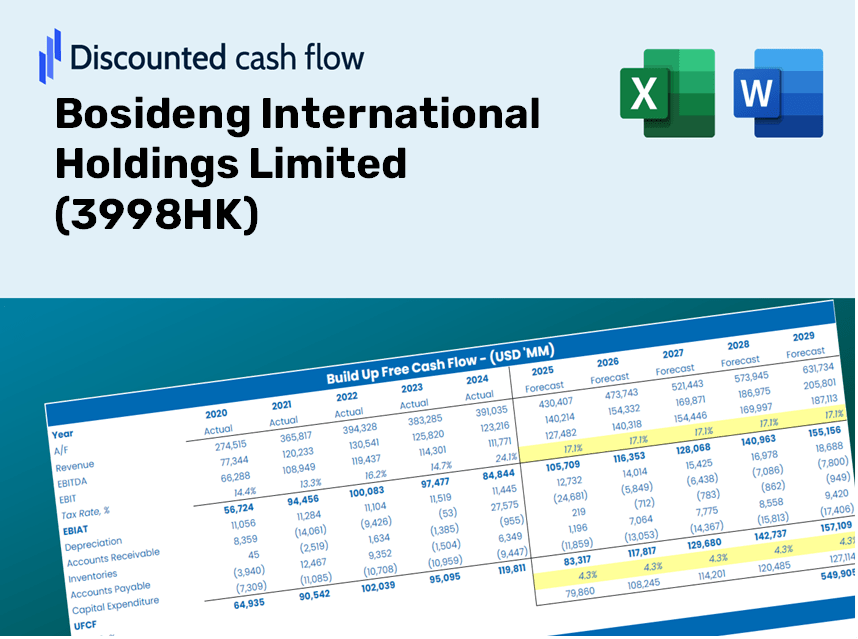
Discounted Cash Flow (DCF) - (USD MM)
| Year | AY1 2020 |
AY2 2021 |
AY3 2022 |
AY4 2023 |
AY5 2024 |
FY1 2025 |
FY2 2026 |
FY3 2027 |
FY4 2028 |
FY5 2029 |
|---|---|---|---|---|---|---|---|---|---|---|
| Revenue | 15,396.4 | 18,468.6 | 19,107.2 | 26,442.7 | 29,504.2 | 34,916.8 | 41,322.3 | 48,903.0 | 57,874.3 | 68,491.4 |
| Revenue Growth, % | 0 | 19.95 | 3.46 | 38.39 | 11.58 | 18.35 | 18.35 | 18.35 | 18.35 | 18.35 |
| EBITDA | 3,148.1 | 3,520.7 | 4,582.3 | 6,779.5 | 7,427.8 | 7,982.4 | 9,446.8 | 11,179.8 | 13,230.7 | 15,658.0 |
| EBITDA, % | 20.45 | 19.06 | 23.98 | 25.64 | 25.18 | 22.86 | 22.86 | 22.86 | 22.86 | 22.86 |
| Depreciation | 921.6 | 1,017.0 | 1,081.5 | 1,386.4 | 1,396.8 | 1,894.6 | 2,242.1 | 2,653.5 | 3,140.2 | 3,716.3 |
| Depreciation, % | 5.99 | 5.51 | 5.66 | 5.24 | 4.73 | 5.43 | 5.43 | 5.43 | 5.43 | 5.43 |
| EBIT | 2,226.5 | 2,503.7 | 3,500.8 | 5,393.1 | 6,031.0 | 6,087.8 | 7,204.6 | 8,526.3 | 10,090.5 | 11,941.6 |
| EBIT, % | 14.46 | 13.56 | 18.32 | 20.4 | 20.44 | 17.44 | 17.44 | 17.44 | 17.44 | 17.44 |
| Total Cash | 9,572.1 | 11,049.1 | 11,029.1 | 13,997.8 | 13,227.1 | 19,377.9 | 22,932.8 | 27,139.8 | 32,118.7 | 38,010.9 |
| Total Cash, percent | .0 | .0 | .0 | .0 | .0 | .0 | .0 | .0 | .0 | .0 |
| Account Receivables | 997.7 | 1,408.8 | 1,051.4 | 1,902.4 | 2,043.0 | 2,355.5 | 2,787.6 | 3,299.0 | 3,904.2 | 4,620.4 |
| Account Receivables, % | 6.48 | 7.63 | 5.5 | 7.19 | 6.92 | 6.75 | 6.75 | 6.75 | 6.75 | 6.75 |
| Inventories | 3,369.4 | 3,486.2 | 3,511.8 | 3,642.2 | 4,500.1 | 6,157.0 | 7,286.5 | 8,623.2 | 10,205.2 | 12,077.3 |
| Inventories, % | 21.88 | 18.88 | 18.38 | 13.77 | 15.25 | 17.63 | 17.63 | 17.63 | 17.63 | 17.63 |
| Accounts Payable | 2,812.0 | 3,739.9 | 3,528.1 | 5,896.9 | 5,930.3 | 6,940.0 | 8,213.1 | 9,719.8 | 11,503.0 | 13,613.2 |
| Accounts Payable, % | 18.26 | 20.25 | 18.46 | 22.3 | 20.1 | 19.88 | 19.88 | 19.88 | 19.88 | 19.88 |
| Capital Expenditure | -497.3 | -656.9 | -578.8 | -637.9 | -1,517.1 | -1,213.0 | -1,435.6 | -1,698.9 | -2,010.6 | -2,379.5 |
| Capital Expenditure, % | -3.23 | -3.56 | -3.03 | -2.41 | -5.14 | -3.47 | -3.47 | -3.47 | -3.47 | -3.47 |
| Tax Rate, % | 31.76 | 31.76 | 31.76 | 31.76 | 31.76 | 31.76 | 31.76 | 31.76 | 31.76 | 31.76 |
| EBITAT | 1,697.5 | 1,932.3 | 2,593.0 | 3,650.7 | 4,115.6 | 4,424.9 | 5,236.7 | 6,197.3 | 7,334.2 | 8,679.7 |
| Depreciation | ||||||||||
| Changes in Account Receivables | ||||||||||
| Changes in Inventories | ||||||||||
| Changes in Accounts Payable | ||||||||||
| Capital Expenditure | ||||||||||
| UFCF | 566.6 | 2,692.5 | 3,215.7 | 5,786.5 | 3,030.3 | 4,146.8 | 5,754.7 | 6,810.5 | 8,059.8 | 9,538.4 |
| WACC, % | 5.89 | 5.89 | 5.88 | 5.86 | 5.86 | 5.88 | 5.88 | 5.88 | 5.88 | 5.88 |
| PV UFCF | ||||||||||
| SUM PV UFCF | 28,371.3 | |||||||||
| Long Term Growth Rate, % | 1.00 | |||||||||
| Free cash flow (T + 1) | 9,634 | |||||||||
| Terminal Value | 197,529 | |||||||||
| Present Terminal Value | 148,464 | |||||||||
| Enterprise Value | 176,835 | |||||||||
| Net Debt | -2,650 | |||||||||
| Equity Value | 179,485 | |||||||||
| Diluted Shares Outstanding, MM | 11,539 | |||||||||
| Equity Value Per Share | 15.55 |
What You Will Receive
- Authentic Bosideng Data: Preloaded financials – encompassing revenue to EBIT – derived from actual and forecasted figures.
- Comprehensive Customization: Modify all essential parameters (yellow cells) such as WACC, growth %, and tax rates.
- Immediate Valuation Adjustments: Automatic recalculations to evaluate the effects of changes on Bosideng’s fair value.
- Flexible Excel Template: Designed for quick modifications, scenario analysis, and thorough projections.
- Efficient and Precise: Eliminate the need to build models from scratch while ensuring accuracy and adaptability.
Key Features
- Authentic Bosideng Data: Comes pre-loaded with historical financial information and future projections for Bosideng International Holdings Limited (3998HK).
- Customizable Inputs: Modify revenue growth rates, profit margins, WACC, tax rates, and capital expenditures to fit your analysis.
- Interactive Valuation Model: Instant updates to Net Present Value (NPV) and intrinsic value in response to your input changes.
- Scenario Analysis: Develop various forecasting scenarios to explore different valuation possibilities.
- User-Friendly Interface: Intuitive layout designed for both industry professionals and newcomers.
How It Works
- Step 1: Download the prebuilt Excel template with Bosideng International's data included.
- Step 2: Explore the pre-filled sheets to familiarize yourself with the key metrics.
- Step 3: Update forecasts and assumptions in the editable yellow cells (WACC, growth, margins).
- Step 4: Instantly view recalculated results, including Bosideng International's intrinsic value.
- Step 5: Make informed investment decisions or create reports using the generated outputs.
Why Choose the Bosideng Calculator?
- Time Efficient: Skip the hassle of building a DCF model from the ground up – it’s ready for immediate use.
- Enhanced Accuracy: Dependable financial data and precise formulas minimize valuation errors.
- Completely Customizable: Adjust the model to suit your specific assumptions and forecasts.
- User-Friendly: Intuitive charts and outputs facilitate straightforward analysis of results.
- Relied Upon by Professionals: Crafted for experts who prioritize accuracy and ease of use.
Who Can Benefit from This Product?
- Professional Investors: Develop comprehensive and accurate valuation models for assessing portfolios focused on Bosideng International Holdings Limited (3998HK).
- Corporate Finance Teams: Evaluate valuation scenarios to inform strategic decisions within their organizations.
- Consultants and Advisors: Equip clients with precise valuation insights specific to Bosideng International Holdings Limited (3998HK).
- Students and Educators: Leverage real-world data to enhance the learning and teaching of financial modeling concepts.
- Fashion Industry Enthusiasts: Gain insights into how companies like Bosideng International Holdings Limited (3998HK) are valued in the fashion market.
Contents of the Template
- Preloaded BGD Data: Historical and projected financial information, including revenue, EBIT, and capital expenditures.
- DCF and WACC Models: Advanced sheets designed for calculating intrinsic value and Weighted Average Cost of Capital.
- Editable Inputs: Yellow-highlighted cells for modifying revenue growth, tax rates, and discount rates.
- Financial Statements: Detailed annual and quarterly financial data for in-depth analysis.
- Key Ratios: Profitability, leverage, and efficiency metrics to assess performance.
- Dashboard and Charts: Visual representations of valuation results and assumptions.
Disclaimer
All information, articles, and product details provided on this website are for general informational and educational purposes only. We do not claim any ownership over, nor do we intend to infringe upon, any trademarks, copyrights, logos, brand names, or other intellectual property mentioned or depicted on this site. Such intellectual property remains the property of its respective owners, and any references here are made solely for identification or informational purposes, without implying any affiliation, endorsement, or partnership.
We make no representations or warranties, express or implied, regarding the accuracy, completeness, or suitability of any content or products presented. Nothing on this website should be construed as legal, tax, investment, financial, medical, or other professional advice. In addition, no part of this site—including articles or product references—constitutes a solicitation, recommendation, endorsement, advertisement, or offer to buy or sell any securities, franchises, or other financial instruments, particularly in jurisdictions where such activity would be unlawful.
All content is of a general nature and may not address the specific circumstances of any individual or entity. It is not a substitute for professional advice or services. Any actions you take based on the information provided here are strictly at your own risk. You accept full responsibility for any decisions or outcomes arising from your use of this website and agree to release us from any liability in connection with your use of, or reliance upon, the content or products found herein.