
|
ISE Chemicals Corporation (4107.T) Avaliação DCF |
Totalmente Editável: Adapte-Se Às Suas Necessidades No Excel Ou Planilhas
Design Profissional: Modelos Confiáveis E Padrão Da Indústria
Pré-Construídos Para Uso Rápido E Eficiente
Compatível com MAC/PC, totalmente desbloqueado
Não É Necessária Experiência; Fácil De Seguir
ISE Chemicals Corporation (4107.T) Bundle
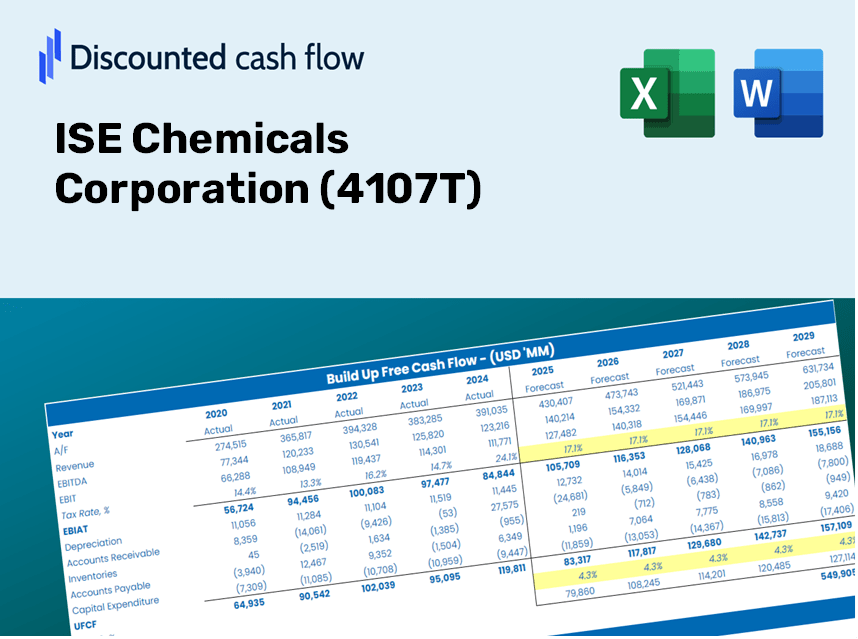
Avalie as perspectivas financeiras da ISE Chemicals Corporation como um especialista! Esta calculadora (4107T) DCF fornece dados financeiros pré-preenchidos e flexibilidade para modificar o crescimento da receita, WACC, margens e outras suposições essenciais para se alinhar às suas projeções.
Discounted Cash Flow (DCF) - (USD MM)
| Year | AY1 2020 |
AY2 2021 |
AY3 2022 |
AY4 2023 |
AY5 2024 |
FY1 2025 |
FY2 2026 |
FY3 2027 |
FY4 2028 |
FY5 2029 |
|---|---|---|---|---|---|---|---|---|---|---|
| Revenue | 16,859.0 | 20,354.0 | 25,564.0 | 26,413.0 | 33,287.0 | 39,584.4 | 47,073.1 | 55,978.7 | 66,569.0 | 79,162.8 |
| Revenue Growth, % | 0 | 20.73 | 25.6 | 3.32 | 26.03 | 18.92 | 18.92 | 18.92 | 18.92 | 18.92 |
| EBITDA | 3,301.0 | 4,082.0 | 5,412.0 | 7,171.0 | 9,388.0 | 9,196.1 | 10,935.9 | 13,004.8 | 15,465.1 | 18,390.8 |
| EBITDA, % | 19.58 | 20.06 | 21.17 | 27.15 | 28.2 | 23.23 | 23.23 | 23.23 | 23.23 | 23.23 |
| Depreciation | 1,311.0 | 1,489.0 | 1,812.0 | 1,970.0 | 1,975.0 | 2,816.2 | 3,348.9 | 3,982.5 | 4,735.9 | 5,631.9 |
| Depreciation, % | 7.78 | 7.32 | 7.09 | 7.46 | 5.93 | 7.11 | 7.11 | 7.11 | 7.11 | 7.11 |
| EBIT | 1,990.0 | 2,593.0 | 3,600.0 | 5,201.0 | 7,413.0 | 6,379.9 | 7,586.9 | 9,022.3 | 10,729.1 | 12,758.9 |
| EBIT, % | 11.8 | 12.74 | 14.08 | 19.69 | 22.27 | 16.12 | 16.12 | 16.12 | 16.12 | 16.12 |
| Total Cash | 3,134.0 | 6,276.0 | 8,387.0 | 9,720.0 | 8,687.0 | 11,489.7 | 13,663.3 | 16,248.2 | 19,322.2 | 22,977.6 |
| Total Cash, percent | .0 | .0 | .0 | .0 | .0 | .0 | .0 | .0 | .0 | .0 |
| Account Receivables | 4,201.0 | 5,254.0 | 6,149.0 | 6,691.0 | 8,919.0 | 10,047.4 | 11,948.2 | 14,208.7 | 16,896.7 | 20,093.3 |
| Account Receivables, % | 24.92 | 25.81 | 24.05 | 25.33 | 26.79 | 25.38 | 25.38 | 25.38 | 25.38 | 25.38 |
| Inventories | 3,808.0 | 3,946.0 | 5,737.0 | 7,595.0 | 10,361.0 | 9,840.4 | 11,702.1 | 13,916.0 | 16,548.6 | 19,679.4 |
| Inventories, % | 22.59 | 19.39 | 22.44 | 28.75 | 31.13 | 24.86 | 24.86 | 24.86 | 24.86 | 24.86 |
| Accounts Payable | 1,420.0 | 2,246.0 | 2,373.0 | 3,079.0 | 3,830.0 | 4,109.1 | 4,886.5 | 5,810.9 | 6,910.3 | 8,217.6 |
| Accounts Payable, % | 8.42 | 11.03 | 9.28 | 11.66 | 11.51 | 10.38 | 10.38 | 10.38 | 10.38 | 10.38 |
| Capital Expenditure | -2,609.0 | -3,297.0 | -2,101.0 | -1,906.0 | -2,767.0 | -4,387.6 | -5,217.7 | -6,204.8 | -7,378.6 | -8,774.6 |
| Capital Expenditure, % | -15.48 | -16.2 | -8.22 | -7.22 | -8.31 | -11.08 | -11.08 | -11.08 | -11.08 | -11.08 |
| Tax Rate, % | 31.57 | 31.57 | 31.57 | 31.57 | 31.57 | 31.57 | 31.57 | 31.57 | 31.57 | 31.57 |
| EBITAT | 1,343.7 | 1,773.7 | 2,562.7 | 3,672.7 | 5,072.4 | 4,416.9 | 5,252.5 | 6,246.1 | 7,427.8 | 8,833.0 |
| Depreciation | ||||||||||
| Changes in Account Receivables | ||||||||||
| Changes in Inventories | ||||||||||
| Changes in Accounts Payable | ||||||||||
| Capital Expenditure | ||||||||||
| UFCF | -6,543.3 | -399.3 | -285.3 | 2,042.7 | 37.4 | 2,516.7 | 398.6 | 474.0 | 563.7 | 670.3 |
| WACC, % | 4.53 | 4.53 | 4.53 | 4.53 | 4.53 | 4.53 | 4.53 | 4.53 | 4.53 | 4.53 |
| PV UFCF | ||||||||||
| SUM PV UFCF | 4,197.0 | |||||||||
| Long Term Growth Rate, % | 2.00 | |||||||||
| Free cash flow (T + 1) | 684 | |||||||||
| Terminal Value | 27,067 | |||||||||
| Present Terminal Value | 21,693 | |||||||||
| Enterprise Value | 25,890 | |||||||||
| Net Debt | -5,128 | |||||||||
| Equity Value | 31,018 | |||||||||
| Diluted Shares Outstanding, MM | 5 | |||||||||
| Equity Value Per Share | 6,086.22 |
What You Will Receive
- Authentic ISE Chemicals Data: Preloaded financial metrics – encompassing revenue to EBIT – derived from actual and projected statistics.
- Comprehensive Customization: Modify all key parameters (indicated in yellow cells) such as WACC, growth %, and tax rates.
- Immediate Valuation Updates: Automatic recalculations to assess the influence of adjustments on ISE Chemicals' fair value.
- Flexible Excel Template: Designed for effortless edits, scenario analyses, and in-depth projections.
- Efficient and Precise: Eliminate the need to construct models from the ground up while ensuring accuracy and adaptability.
Key Features
- Pre-Loaded Data: ISE Chemicals Corporation’s historical financial statements and pre-filled forecasts.
- Fully Adjustable Inputs: Modify WACC, tax rates, revenue growth, and EBITDA margins as needed.
- Instant Results: Watch the intrinsic value of ISE Chemicals Corporation recalibrate in real time.
- Clear Visual Outputs: Dashboard charts illustrate valuation results and essential metrics clearly.
- Built for Accuracy: A professional-grade tool designed for analysts, investors, and finance professionals.
How It Works
- Step 1: Download the Excel file for ISE Chemicals Corporation (4107T).
- Step 2: Review the pre-filled data on ISE Chemicals (historical and projected).
- Step 3: Modify key assumptions (highlighted in yellow) according to your findings.
- Step 4: Observe the automatic updates for ISE Chemicals' intrinsic value.
- Step 5: Leverage the results for your investment strategies or reporting needs.
Why Opt for the ISE Chemicals Corporation ([4107T]) Calculator?
- Time Efficiency: Skip the hassle of building a DCF model from the ground up – it’s ready for immediate use.
- Enhanced Accuracy: Dependable financial data and formulas minimize valuation errors.
- Completely Customizable: Modify the model to align with your specific assumptions and forecasts.
- User-Friendly: Intuitive charts and outputs simplify the analysis of results.
- Endorsed by Professionals: Crafted for experts who prioritize precision and functionality.
Who Can Benefit from This Product?
- Investors: Accurately assess ISE Chemicals Corporation's (4107T) fair value prior to making investment choices.
- CFOs: Utilize a professional-grade DCF model for comprehensive financial reporting and analysis.
- Consultants: Easily customize the template for valuation reports tailored to clients.
- Entrepreneurs: Acquire valuable insights into the financial modeling practices of Fortune 500 firms.
- Educators: Employ it as a teaching resource to illustrate various valuation methodologies.
Contents of the Template
- Pre-Filled Data: Contains ISE Chemicals Corporation's historical financial performance and projections.
- Discounted Cash Flow Model: An editable DCF valuation model featuring automatic calculations.
- Weighted Average Cost of Capital (WACC): A dedicated worksheet to calculate WACC using custom inputs.
- Key Financial Ratios: Evaluate ISE Chemicals Corporation's profitability, efficiency, and leverage metrics.
- Customizable Inputs: Easily adjust revenue growth, profit margins, and tax rates.
- User-Friendly Dashboard: Visual representations and tables that summarize essential valuation outcomes.
Disclaimer
All information, articles, and product details provided on this website are for general informational and educational purposes only. We do not claim any ownership over, nor do we intend to infringe upon, any trademarks, copyrights, logos, brand names, or other intellectual property mentioned or depicted on this site. Such intellectual property remains the property of its respective owners, and any references here are made solely for identification or informational purposes, without implying any affiliation, endorsement, or partnership.
We make no representations or warranties, express or implied, regarding the accuracy, completeness, or suitability of any content or products presented. Nothing on this website should be construed as legal, tax, investment, financial, medical, or other professional advice. In addition, no part of this site—including articles or product references—constitutes a solicitation, recommendation, endorsement, advertisement, or offer to buy or sell any securities, franchises, or other financial instruments, particularly in jurisdictions where such activity would be unlawful.
All content is of a general nature and may not address the specific circumstances of any individual or entity. It is not a substitute for professional advice or services. Any actions you take based on the information provided here are strictly at your own risk. You accept full responsibility for any decisions or outcomes arising from your use of this website and agree to release us from any liability in connection with your use of, or reliance upon, the content or products found herein.