
|
Nippon Shokubai Co., Ltd. (4114.T) DCF Avaliação |
Totalmente Editável: Adapte-Se Às Suas Necessidades No Excel Ou Planilhas
Design Profissional: Modelos Confiáveis E Padrão Da Indústria
Pré-Construídos Para Uso Rápido E Eficiente
Compatível com MAC/PC, totalmente desbloqueado
Não É Necessária Experiência; Fácil De Seguir
Nippon Shokubai Co., Ltd. (4114.T) Bundle
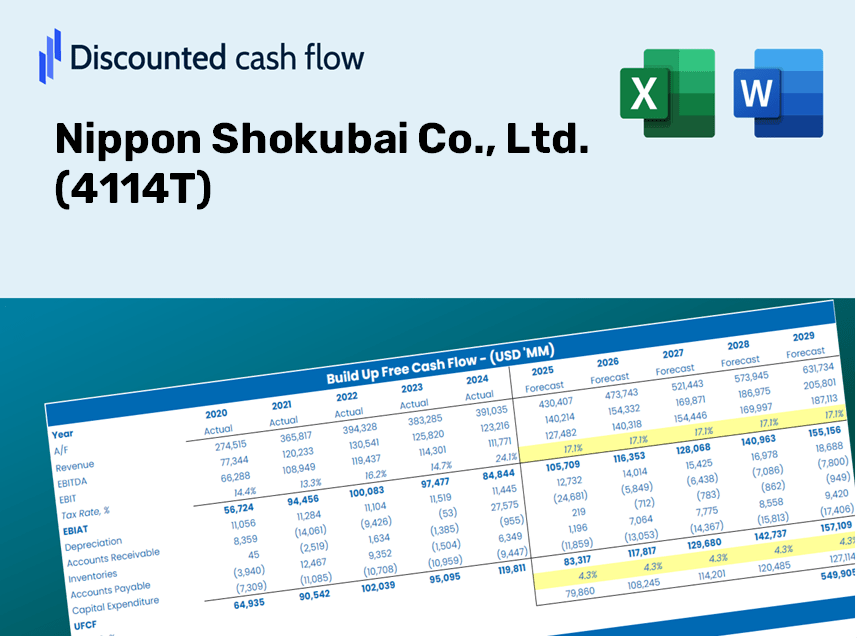
Seja você um investidor ou analista, esta calculadora DCF (4114T) é sua ferramenta final para uma avaliação precisa. Pré -carregado com dados reais da Nippon Shokubai Co., Ltd., você pode ajustar as previsões e observar os efeitos em tempo real.
Discounted Cash Flow (DCF) - (USD MM)
| Year | AY1 2020 |
AY2 2021 |
AY3 2022 |
AY4 2023 |
AY5 2024 |
FY1 2025 |
FY2 2026 |
FY3 2027 |
FY4 2028 |
FY5 2029 |
|---|---|---|---|---|---|---|---|---|---|---|
| Revenue | 273,163.0 | 369,293.0 | 419,568.0 | 392,009.0 | 409,346.0 | 457,095.7 | 510,415.3 | 569,954.6 | 636,439.0 | 710,678.8 |
| Revenue Growth, % | 0 | 35.19 | 13.61 | -6.57 | 4.42 | 11.66 | 11.66 | 11.66 | 11.66 | 11.66 |
| EBITDA | 15,445.0 | 59,869.0 | 54,695.0 | 49,738.0 | 53,136.0 | 55,373.1 | 61,832.3 | 69,045.0 | 77,099.0 | 86,092.5 |
| EBITDA, % | 5.65 | 16.21 | 13.04 | 12.69 | 12.98 | 12.11 | 12.11 | 12.11 | 12.11 | 12.11 |
| Depreciation | 29,470.0 | 28,875.0 | 29,312.0 | 31,853.0 | 31,551.0 | 37,872.1 | 42,289.8 | 47,222.9 | 52,731.4 | 58,882.4 |
| Depreciation, % | 10.79 | 7.82 | 6.99 | 8.13 | 7.71 | 8.29 | 8.29 | 8.29 | 8.29 | 8.29 |
| EBIT | -14,025.0 | 30,994.0 | 25,383.0 | 17,885.0 | 21,585.0 | 17,501.0 | 19,542.5 | 21,822.1 | 24,367.6 | 27,210.1 |
| EBIT, % | -5.13 | 8.39 | 6.05 | 4.56 | 5.27 | 3.83 | 3.83 | 3.83 | 3.83 | 3.83 |
| Total Cash | 36,341.0 | 39,363.0 | 39,035.0 | 55,129.0 | 54,565.0 | 55,454.3 | 61,923.0 | 69,146.2 | 77,212.0 | 86,218.7 |
| Total Cash, percent | .0 | .0 | .0 | .0 | .0 | .0 | .0 | .0 | .0 | .0 |
| Account Receivables | 82,053.0 | 103,577.0 | 98,571.0 | 98,181.0 | 96,465.0 | 119,018.7 | 132,902.1 | 148,405.0 | 165,716.2 | 185,046.8 |
| Account Receivables, % | 30.04 | 28.05 | 23.49 | 25.05 | 23.57 | 26.04 | 26.04 | 26.04 | 26.04 | 26.04 |
| Inventories | 57,612.0 | 75,311.0 | 86,056.0 | 84,446.0 | 84,315.0 | 95,198.4 | 106,303.1 | 118,703.2 | 132,549.8 | 148,011.6 |
| Inventories, % | 21.09 | 20.39 | 20.51 | 21.54 | 20.6 | 20.83 | 20.83 | 20.83 | 20.83 | 20.83 |
| Accounts Payable | 45,912.0 | 57,616.0 | 53,138.0 | 61,351.0 | 54,821.0 | 67,757.1 | 75,660.8 | 84,486.6 | 94,341.8 | 105,346.7 |
| Accounts Payable, % | 16.81 | 15.6 | 12.66 | 15.65 | 13.39 | 14.82 | 14.82 | 14.82 | 14.82 | 14.82 |
| Capital Expenditure | -31,386.0 | -22,256.0 | -23,085.0 | -20,567.0 | -33,920.0 | -33,415.1 | -37,312.9 | -41,665.4 | -46,525.6 | -51,952.8 |
| Capital Expenditure, % | -11.49 | -6.03 | -5.5 | -5.25 | -8.29 | -7.31 | -7.31 | -7.31 | -7.31 | -7.31 |
| Tax Rate, % | 9.35 | 9.35 | 9.35 | 9.35 | 9.35 | 9.35 | 9.35 | 9.35 | 9.35 | 9.35 |
| EBITAT | -11,825.7 | 21,831.6 | 18,805.2 | 12,505.0 | 19,566.9 | 13,630.2 | 15,220.2 | 16,995.6 | 18,978.1 | 21,191.8 |
| Depreciation | ||||||||||
| Changes in Account Receivables | ||||||||||
| Changes in Inventories | ||||||||||
| Changes in Accounts Payable | ||||||||||
| Capital Expenditure | ||||||||||
| UFCF | -107,494.7 | 931.6 | 14,815.2 | 34,004.0 | 12,514.9 | -2,413.8 | 3,112.7 | 3,475.8 | 3,881.2 | 4,334.0 |
| WACC, % | 4.69 | 4.59 | 4.61 | 4.58 | 4.74 | 4.64 | 4.64 | 4.64 | 4.64 | 4.64 |
| PV UFCF | ||||||||||
| SUM PV UFCF | 10,260.9 | |||||||||
| Long Term Growth Rate, % | 2.00 | |||||||||
| Free cash flow (T + 1) | 4,421 | |||||||||
| Terminal Value | 167,355 | |||||||||
| Present Terminal Value | 133,389 | |||||||||
| Enterprise Value | 143,650 | |||||||||
| Net Debt | -13,174 | |||||||||
| Equity Value | 156,824 | |||||||||
| Diluted Shares Outstanding, MM | 153 | |||||||||
| Equity Value Per Share | 1,026.56 |
Benefits You Will Receive
- Comprehensive Financial Model: Utilizes Nippon Shokubai's actual data for accurate DCF valuation.
- Complete Forecast Control: Customize revenue growth, profit margins, WACC, and other crucial parameters.
- Real-Time Calculations: Automatic updates allow you to view results instantly as you modify inputs.
- Professional-Grade Template: A polished Excel file crafted for high-quality valuation presentations.
- Flexible and Reusable: Designed for adaptability, facilitating repeated use for in-depth forecasts.
Key Features
- Comprehensive Historical Data: Nippon Shokubai's (4114T) past financial reports and pre-filled projections.
- Customizable Inputs: Adjust WACC, tax rates, revenue growth, and EBITDA margins to fit your analysis.
- Real-Time Calculations: Instantly view the intrinsic value of Nippon Shokubai (4114T) as it updates live.
- Intuitive Visual Representation: Interactive dashboard charts showcase valuation outcomes and essential metrics.
- Designed for Precision: A professional-grade tool tailored for analysts, investors, and finance professionals.
How It Operates
- 1. Access the Template: Download and open the Excel file containing Nippon Shokubai Co., Ltd.'s (4114T) preloaded data.
- 2. Modify Assumptions: Adjust key inputs such as growth rates, WACC, and capital expenditures.
- 3. Instant Results: The DCF model automatically calculates intrinsic value and NPV in real-time.
- 4. Explore Scenarios: Evaluate multiple forecasts to understand various valuation outcomes.
- 5. Present with Assurance: Share professional valuation insights to bolster your decision-making.
Why Select This Calculator for Nippon Shokubai Co., Ltd. (4114T)?
- Reliable Data: Access accurate financial metrics for Nippon Shokubai to ensure dependable valuation outcomes.
- Fully Customizable: Tailor essential variables such as growth rates, WACC, and tax rates to align with your specific forecasts.
- Efficient: Pre-configured calculations save you the hassle of building from the ground up.
- Professional-Quality Tool: Perfectly suited for investors, analysts, and consultants in the industry.
- User-Friendly: Easily navigable interface and clear instructions make it accessible for users of all experience levels.
Who Should Utilize This Product?
- Individual Investors: Gain insights to make informed decisions regarding buying or selling Nippon Shokubai Co., Ltd. (4114T) shares.
- Financial Analysts: Enhance valuation procedures with comprehensive financial models tailored for Nippon Shokubai Co., Ltd. (4114T).
- Consultants: Provide clients with precise and professional valuation assessments of Nippon Shokubai Co., Ltd. (4114T).
- Business Owners: Learn about the valuation of major companies like Nippon Shokubai Co., Ltd. (4114T) to inform your own business strategies.
- Finance Students: Explore valuation methods through the lens of real-world data and scenarios involving Nippon Shokubai Co., Ltd. (4114T).
Components of the Template
- Pre-Populated Data: Features Nippon Shokubai’s historical financial performance and projections.
- Discounted Cash Flow Model: An editable DCF valuation framework with automatic computation.
- Weighted Average Cost of Capital (WACC): A specialized sheet for WACC calculation based on your specific inputs.
- Essential Financial Ratios: Evaluate Nippon Shokubai’s profitability, operational efficiency, and financial leverage.
- Customizable Parameters: Easily modify revenue growth, profit margins, and tax rates.
- Intuitive Dashboard: Visual representations and tables that encapsulate key valuation outcomes.
Disclaimer
All information, articles, and product details provided on this website are for general informational and educational purposes only. We do not claim any ownership over, nor do we intend to infringe upon, any trademarks, copyrights, logos, brand names, or other intellectual property mentioned or depicted on this site. Such intellectual property remains the property of its respective owners, and any references here are made solely for identification or informational purposes, without implying any affiliation, endorsement, or partnership.
We make no representations or warranties, express or implied, regarding the accuracy, completeness, or suitability of any content or products presented. Nothing on this website should be construed as legal, tax, investment, financial, medical, or other professional advice. In addition, no part of this site—including articles or product references—constitutes a solicitation, recommendation, endorsement, advertisement, or offer to buy or sell any securities, franchises, or other financial instruments, particularly in jurisdictions where such activity would be unlawful.
All content is of a general nature and may not address the specific circumstances of any individual or entity. It is not a substitute for professional advice or services. Any actions you take based on the information provided here are strictly at your own risk. You accept full responsibility for any decisions or outcomes arising from your use of this website and agree to release us from any liability in connection with your use of, or reliance upon, the content or products found herein.