
|
Nomura Research Institute, Ltd. (4307.T) Avaliação DCF |
Totalmente Editável: Adapte-Se Às Suas Necessidades No Excel Ou Planilhas
Design Profissional: Modelos Confiáveis E Padrão Da Indústria
Pré-Construídos Para Uso Rápido E Eficiente
Compatível com MAC/PC, totalmente desbloqueado
Não É Necessária Experiência; Fácil De Seguir
Nomura Research Institute, Ltd. (4307.T) Bundle
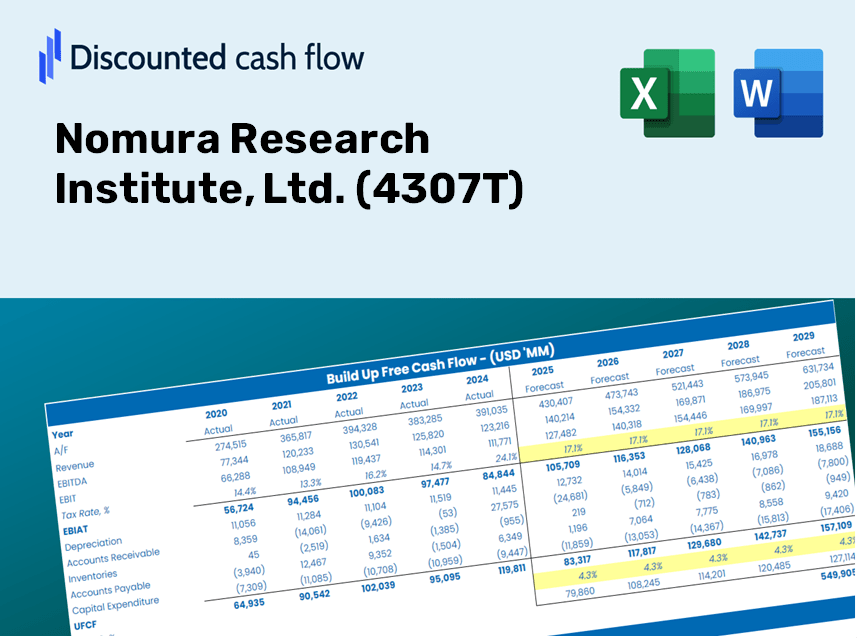
Como investidor ou analista, essa calculadora DCF [símbolo] é um recurso essencial para uma avaliação precisa. Carregado com dados reais do Nomura Research Institute, Ltd., você pode ajustar as previsões e observar instantaneamente os efeitos.
Discounted Cash Flow (DCF) - (USD MM)
| Year | AY1 2021 |
AY2 2022 |
AY3 2023 |
AY4 2024 |
AY5 2025 |
FY1 2026 |
FY2 2027 |
FY3 2028 |
FY4 2029 |
FY5 2030 |
|---|---|---|---|---|---|---|---|---|---|---|
| Revenue | 550,337.0 | 611,634.0 | 692,165.0 | 736,556.0 | 764,813.0 | 830,882.0 | 902,658.5 | 980,635.4 | 1,065,348.4 | 1,157,379.5 |
| Revenue Growth, % | 0 | 11.14 | 13.17 | 6.41 | 3.84 | 8.64 | 8.64 | 8.64 | 8.64 | 8.64 |
| EBITDA | 123,817.0 | 149,082.0 | 159,142.0 | 171,259.0 | 187,973.0 | 195,579.1 | 212,474.4 | 230,829.1 | 250,769.5 | 272,432.4 |
| EBITDA, % | 22.5 | 24.37 | 22.99 | 23.25 | 24.58 | 23.54 | 23.54 | 23.54 | 23.54 | 23.54 |
| Depreciation | 40,911.0 | 41,941.0 | 45,092.0 | 48,157.0 | 48,910.0 | 56,065.9 | 60,909.2 | 66,170.9 | 71,887.2 | 78,097.2 |
| Depreciation, % | 7.43 | 6.86 | 6.51 | 6.54 | 6.4 | 6.75 | 6.75 | 6.75 | 6.75 | 6.75 |
| EBIT | 82,906.0 | 107,141.0 | 114,050.0 | 123,102.0 | 139,063.0 | 139,513.2 | 151,565.1 | 164,658.2 | 178,882.3 | 194,335.2 |
| EBIT, % | 15.06 | 17.52 | 16.48 | 16.71 | 18.18 | 16.79 | 16.79 | 16.79 | 16.79 | 16.79 |
| Total Cash | 153,187.0 | 115,610.0 | 129,257.0 | 173,935.0 | 168,597.0 | 184,572.3 | 200,516.7 | 217,838.6 | 236,656.7 | 257,100.5 |
| Total Cash, percent | .0 | .0 | .0 | .0 | .0 | .0 | .0 | .0 | .0 | .0 |
| Account Receivables | 149,245.0 | 186,344.0 | 187,572.0 | 197,936.0 | 216,732.0 | 232,473.9 | 252,556.3 | 274,373.6 | 298,075.6 | 323,825.1 |
| Account Receivables, % | 27.12 | 30.47 | 27.1 | 26.87 | 28.34 | 27.98 | 27.98 | 27.98 | 27.98 | 27.98 |
| Inventories | 42,921.0 | 55,094.0 | 55,980.0 | .0 | .0 | 41,368.6 | 44,942.2 | 48,824.6 | 53,042.4 | 57,624.5 |
| Inventories, % | 7.8 | 9.01 | 8.09 | 0 | 0 | 4.98 | 4.98 | 4.98 | 4.98 | 4.98 |
| Accounts Payable | 37,358.0 | 53,800.0 | 55,681.0 | 53,038.0 | 58,146.0 | 63,865.3 | 69,382.4 | 75,376.0 | 81,887.4 | 88,961.4 |
| Accounts Payable, % | 6.79 | 8.8 | 8.04 | 7.2 | 7.6 | 7.69 | 7.69 | 7.69 | 7.69 | 7.69 |
| Capital Expenditure | -29,029.0 | -42,977.0 | -54,701.0 | -49,797.0 | -6,660.0 | -46,256.6 | -50,252.5 | -54,593.6 | -59,309.7 | -64,433.2 |
| Capital Expenditure, % | -5.27 | -7.03 | -7.9 | -6.76 | -0.8708 | -5.57 | -5.57 | -5.57 | -5.57 | -5.57 |
| Tax Rate, % | 29.64 | 29.64 | 29.64 | 29.64 | 29.64 | 29.64 | 29.64 | 29.64 | 29.64 | 29.64 |
| EBITAT | 61,667.1 | 73,130.9 | 80,211.0 | 83,636.6 | 97,845.7 | 98,013.6 | 106,480.6 | 115,679.0 | 125,672.0 | 136,528.3 |
| Depreciation | ||||||||||
| Changes in Account Receivables | ||||||||||
| Changes in Inventories | ||||||||||
| Changes in Accounts Payable | ||||||||||
| Capital Expenditure | ||||||||||
| UFCF | -81,258.9 | 39,264.9 | 70,369.0 | 124,969.6 | 126,407.7 | 56,431.8 | 98,998.2 | 107,550.3 | 116,841.1 | 126,934.5 |
| WACC, % | 6.06 | 6.04 | 6.05 | 6.04 | 6.05 | 6.05 | 6.05 | 6.05 | 6.05 | 6.05 |
| PV UFCF | ||||||||||
| SUM PV UFCF | 418,413.2 | |||||||||
| Long Term Growth Rate, % | 2.00 | |||||||||
| Free cash flow (T + 1) | 129,473 | |||||||||
| Terminal Value | 3,196,745 | |||||||||
| Present Terminal Value | 2,383,150 | |||||||||
| Enterprise Value | 2,801,564 | |||||||||
| Net Debt | 102,426 | |||||||||
| Equity Value | 2,699,138 | |||||||||
| Diluted Shares Outstanding, MM | 573 | |||||||||
| Equity Value Per Share | 4,708.41 |
Benefits You Will Receive
- Flexible Assumption Inputs: Easily modify variables (growth %, margins, WACC) to explore various scenarios.
- Real-World Data: Nomura Research Institute’s financial data pre-loaded to facilitate your analysis.
- Automated DCF Results: The template calculates Net Present Value (NPV) and intrinsic value automatically.
- Customizable and Professional Design: A refined Excel model tailored to meet your valuation requirements.
- Designed for Analysts and Investors: Perfect for evaluating projections, validating strategies, and enhancing efficiency.
Highlighted Features
- Customizable Forecast Inputs: Adjust essential metrics such as revenue growth, EBITDA margin, and capital expenditures.
- Instant DCF Valuation: Quickly derives intrinsic value, NPV, and additional financial outputs.
- High-Precision Results: Leverages Nomura Research Institute’s (4307T) actual financial data for accurate valuation insights.
- Simplified Scenario Analysis: Evaluate varying assumptions and view results side by side effortlessly.
- Efficiency Boost: Save time by avoiding the need to create intricate valuation models from the ground up.
How It Functions
- Step 1: Download the Excel template.
- Step 2: Examine the pre-filled Nomura Research Institute data (historical and projected).
- Step 3: Modify the key assumptions (yellow cells) according to your insights.
- Step 4: Observe the automatic updates to Nomura Research Institute’s intrinsic value.
- Step 5: Utilize the results for investment strategies or reporting purposes.
Why Choose This Calculator for Nomura Research Institute, Ltd. (4307T)?
- User-Friendly Interface: Perfect for both novices and seasoned professionals.
- Customizable Parameters: Adjust inputs to tailor your financial analysis.
- Real-Time Adjustments: Watch immediate updates to Nomura’s valuation as you change inputs.
- Pre-Configured Data: Comes with Nomura’s actual financial metrics for effortless evaluation.
- Preferred by Experts: A go-to tool for investors and analysts aiming for informed insights.
Who Can Benefit from Our Services?
- Investment Professionals: Develop comprehensive and trustworthy valuation models for portfolio assessments.
- Corporate Finance Departments: Evaluate valuation scenarios to inform strategic decision-making.
- Advisors and Consultants: Deliver precise valuation analyses to clients regarding Nomura Research Institute, Ltd. (4307T).
- Students and Academic Instructors: Utilize real-world data to enhance learning and practice in financial modeling.
- Technology Enthusiasts: Gain insights into how technology firms like Nomura Research Institute, Ltd. (4307T) are valued in the financial landscape.
Contents of the Template
- Operating and Balance Sheet Data: Pre-filled historical financial data and forecasts for Nomura Research Institute, Ltd. (4307T), including revenue, EBITDA, EBIT, and capital expenditures.
- WACC Calculation: A specialized sheet for calculating the Weighted Average Cost of Capital (WACC), featuring inputs such as Beta, risk-free rate, and share price.
- DCF Valuation (Unlevered and Levered): Customizable Discounted Cash Flow models that present the intrinsic value along with comprehensive calculations.
- Financial Statements: Pre-loaded financial statements (both annual and quarterly) to facilitate thorough analysis.
- Key Ratios: Contains profitability, leverage, and efficiency ratios specific to Nomura Research Institute, Ltd. (4307T).
- Dashboard and Charts: Visual representation of valuation outcomes and underlying assumptions for streamlined analysis.
Disclaimer
All information, articles, and product details provided on this website are for general informational and educational purposes only. We do not claim any ownership over, nor do we intend to infringe upon, any trademarks, copyrights, logos, brand names, or other intellectual property mentioned or depicted on this site. Such intellectual property remains the property of its respective owners, and any references here are made solely for identification or informational purposes, without implying any affiliation, endorsement, or partnership.
We make no representations or warranties, express or implied, regarding the accuracy, completeness, or suitability of any content or products presented. Nothing on this website should be construed as legal, tax, investment, financial, medical, or other professional advice. In addition, no part of this site—including articles or product references—constitutes a solicitation, recommendation, endorsement, advertisement, or offer to buy or sell any securities, franchises, or other financial instruments, particularly in jurisdictions where such activity would be unlawful.
All content is of a general nature and may not address the specific circumstances of any individual or entity. It is not a substitute for professional advice or services. Any actions you take based on the information provided here are strictly at your own risk. You accept full responsibility for any decisions or outcomes arising from your use of this website and agree to release us from any liability in connection with your use of, or reliance upon, the content or products found herein.