
|
Dentsu Group Inc. (4324.T) Avaliação DCF |
Totalmente Editável: Adapte-Se Às Suas Necessidades No Excel Ou Planilhas
Design Profissional: Modelos Confiáveis E Padrão Da Indústria
Pré-Construídos Para Uso Rápido E Eficiente
Compatível com MAC/PC, totalmente desbloqueado
Não É Necessária Experiência; Fácil De Seguir
Dentsu Group Inc. (4324.T) Bundle
Explore as perspectivas financeiras do Dentsu Group Inc. (4324T) com nossa calculadora DCF amigável! Digite suas projeções de crescimento, margens e despesas para calcular o valor intrínseco do Dentsu Group Inc. (4324T) e refine sua abordagem de investimento.
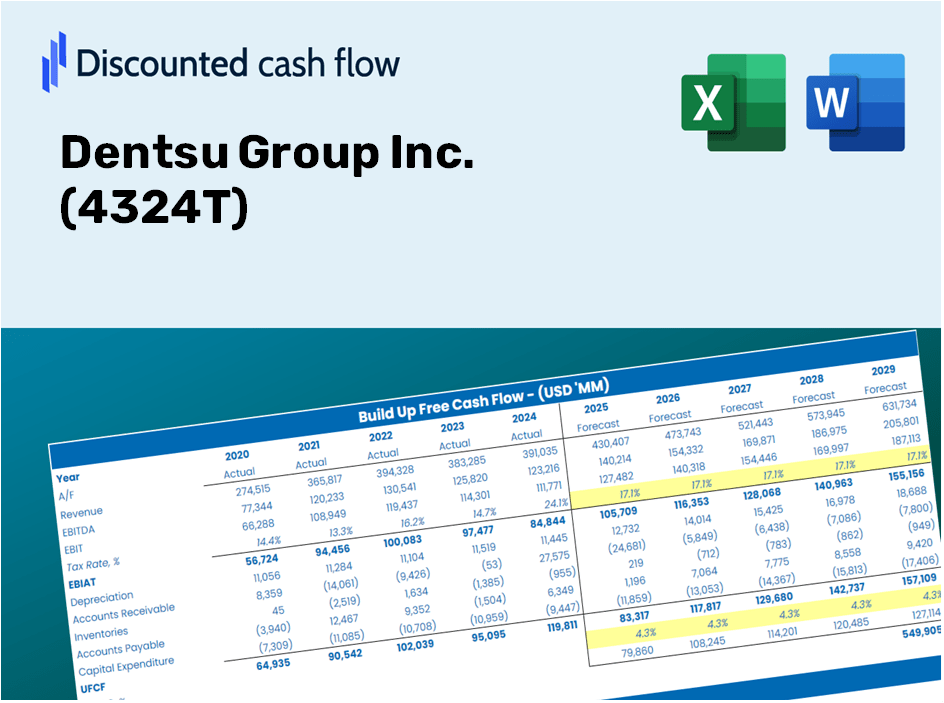
Discounted Cash Flow (DCF) - (USD MM)
| Year | AY1 2020 |
AY2 2021 |
AY3 2022 |
AY4 2023 |
AY5 2024 |
FY1 2025 |
FY2 2026 |
FY3 2027 |
FY4 2028 |
FY5 2029 |
|---|---|---|---|---|---|---|---|---|---|---|
| Revenue | 939,243.0 | 1,085,592.0 | 1,243,883.0 | 1,304,552.0 | 1,410,961.0 | 1,563,333.5 | 1,732,161.0 | 1,919,220.6 | 2,126,481.0 | 2,356,124.0 |
| Revenue Growth, % | 0 | 15.58 | 14.58 | 4.88 | 8.16 | 10.8 | 10.8 | 10.8 | 10.8 | 10.8 |
| EBITDA | -32,614.0 | 302,494.0 | 203,156.0 | 139,503.0 | -29,596.0 | 154,208.6 | 170,861.9 | 189,313.6 | 209,758.0 | 232,410.1 |
| EBITDA, % | -3.47 | 27.86 | 16.33 | 10.69 | -2.1 | 9.86 | 9.86 | 9.86 | 9.86 | 9.86 |
| Depreciation | 90,623.0 | 78,657.0 | 74,170.0 | 78,719.0 | 81,449.0 | 108,381.5 | 120,085.9 | 133,054.2 | 147,423.0 | 163,343.5 |
| Depreciation, % | 9.65 | 7.25 | 5.96 | 6.03 | 5.77 | 6.93 | 6.93 | 6.93 | 6.93 | 6.93 |
| EBIT | -123,237.0 | 223,837.0 | 128,986.0 | 60,784.0 | -111,045.0 | 45,827.0 | 50,776.0 | 56,259.4 | 62,335.0 | 69,066.6 |
| EBIT, % | -13.12 | 20.62 | 10.37 | 4.66 | -7.87 | 2.93 | 2.93 | 2.93 | 2.93 | 2.93 |
| Total Cash | 530,692.0 | 723,541.0 | 603,740.0 | 390,678.0 | 397,187.0 | 718,463.2 | 796,051.5 | 882,018.7 | 977,269.7 | 1,082,807.0 |
| Total Cash, percent | .0 | .0 | .0 | .0 | .0 | .0 | .0 | .0 | .0 | .0 |
| Account Receivables | 1,293,370.0 | 1,500,020.0 | 1,531,957.0 | 1,576,483.0 | 1,678,146.0 | 1,563,333.5 | 1,732,161.0 | 1,919,220.6 | 2,126,481.0 | 2,356,124.0 |
| Account Receivables, % | 137.7 | 138.18 | 123.16 | 120.84 | 118.94 | 100 | 100 | 100 | 100 | 100 |
| Inventories | 23,848.0 | 20,661.0 | 3,670.0 | 6,396.0 | 6,095.0 | 17,695.6 | 19,606.6 | 21,723.9 | 24,069.9 | 26,669.3 |
| Inventories, % | 2.54 | 1.9 | 0.29504 | 0.49028 | 0.43198 | 1.13 | 1.13 | 1.13 | 1.13 | 1.13 |
| Accounts Payable | 1,247,172.0 | 1,465,110.0 | 1,470,374.0 | 1,527,612.0 | 1,566,979.0 | 1,563,333.5 | 1,732,161.0 | 1,919,220.6 | 2,126,481.0 | 2,356,124.0 |
| Accounts Payable, % | 132.78 | 134.96 | 118.21 | 117.1 | 111.06 | 100 | 100 | 100 | 100 | 100 |
| Capital Expenditure | -21,474.0 | -21,036.0 | -18,526.0 | -28,892.0 | -25,684.0 | -30,480.2 | -33,771.8 | -37,418.8 | -41,459.8 | -45,937.1 |
| Capital Expenditure, % | -2.29 | -1.94 | -1.49 | -2.21 | -1.82 | -1.95 | -1.95 | -1.95 | -1.95 | -1.95 |
| Tax Rate, % | -37.5 | -37.5 | -37.5 | -37.5 | -37.5 | -37.5 | -37.5 | -37.5 | -37.5 | -37.5 |
| EBITAT | -139,358.0 | 116,176.4 | 76,499.6 | -19,673.1 | -152,689.6 | 28,523.7 | 31,604.1 | 35,017.1 | 38,798.6 | 42,988.6 |
| Depreciation | ||||||||||
| Changes in Account Receivables | ||||||||||
| Changes in Inventories | ||||||||||
| Changes in Accounts Payable | ||||||||||
| Capital Expenditure | ||||||||||
| UFCF | -140,255.0 | 188,272.4 | 122,461.6 | 40,139.9 | -158,919.6 | 205,991.5 | 116,007.2 | 128,535.1 | 142,415.8 | 157,795.6 |
| WACC, % | 5.56 | 4.45 | 4.62 | 3.24 | 5.56 | 4.69 | 4.69 | 4.69 | 4.69 | 4.69 |
| PV UFCF | ||||||||||
| SUM PV UFCF | 658,716.6 | |||||||||
| Long Term Growth Rate, % | 2.00 | |||||||||
| Free cash flow (T + 1) | 160,952 | |||||||||
| Terminal Value | 5,989,188 | |||||||||
| Present Terminal Value | 4,763,175 | |||||||||
| Enterprise Value | 5,421,891 | |||||||||
| Net Debt | 175,284 | |||||||||
| Equity Value | 5,246,607 | |||||||||
| Diluted Shares Outstanding, MM | 262 | |||||||||
| Equity Value Per Share | 20,054.61 |
What You Will Receive
- Accurate Dentsu Financial Data: Pre-loaded with historical and forecasted data for thorough analysis.
- Customizable Template: Easily adjust key parameters such as revenue growth, WACC, and EBITDA margin.
- Instant Calculations: Observe real-time updates to Dentsu’s intrinsic value as you make changes.
- Professional Valuation Tool: Crafted for investors, analysts, and consultants aiming for reliable DCF results.
- Intuitive Design: Organized layout and straightforward instructions suitable for all skill levels.
Key Features
- Pre-Loaded Data: Dentsu Group Inc.'s historical financial reports and pre-filled forecasts.
- Fully Adjustable Inputs: Customize WACC, tax rates, revenue growth, and EBITDA margins.
- Instant Results: Watch Dentsu Group Inc.'s intrinsic value update in real time.
- Clear Visual Outputs: Dashboard charts showcase valuation results and essential metrics.
- Built for Accuracy: A reliable tool designed for analysts, investors, and finance professionals.
How It Works
- Step 1: Download the Excel file.
- Step 2: Examine the pre-filled data for Dentsu Group Inc. (4324T) including historical performance and forecasts.
- Step 3: Modify the key assumptions (highlighted in yellow) according to your analysis.
- Step 4: Observe the automatic updates for Dentsu Group Inc.’s (4324T) intrinsic value.
- Step 5: Utilize the results for investment strategies or reporting purposes.
Why Choose This Calculator for Dentsu Group Inc. (4324T)?
- Reliable Data: Utilize authentic Dentsu financials for trustworthy valuation outcomes.
- Tailorable: Modify essential variables such as growth rates, WACC, and tax rates to fit your forecasts.
- Efficient: Built-in calculations save you the effort of starting from the ground up.
- Expert-Level Tool: Crafted for investors, analysts, and consultants in mind.
- Accessible: User-friendly design and clear instructions make it suitable for everyone.
Who Can Benefit from This Product?
- Professional Investors: Create comprehensive and reliable valuation models for analyzing their portfolios, particularly for Dentsu Group Inc. (4324T).
- Corporate Finance Teams: Evaluate various valuation scenarios to inform strategic decisions within their organizations.
- Consultants and Advisors: Equip clients with precise valuation insights concerning Dentsu Group Inc. (4324T).
- Students and Educators: Leverage real-world data to enhance learning and practice in financial modeling.
- Marketing Professionals: Gain insights into how companies like Dentsu Group Inc. (4324T) are valued in the advertising industry.
Contents of the Template
- Pre-Filled DCF Model: Dentsu Group Inc.’s financial information preloaded for instant access.
- WACC Calculator: Comprehensive calculations for Weighted Average Cost of Capital.
- Financial Ratios: Analyze Dentsu Group Inc.'s profitability, leverage, and operational efficiency.
- Editable Inputs: Modify assumptions like growth rates, profit margins, and capital expenditures to suit your scenarios.
- Financial Statements: Access annual and quarterly reports for in-depth analysis.
- Interactive Dashboard: Effortlessly visualize essential valuation metrics and outcomes.
Disclaimer
All information, articles, and product details provided on this website are for general informational and educational purposes only. We do not claim any ownership over, nor do we intend to infringe upon, any trademarks, copyrights, logos, brand names, or other intellectual property mentioned or depicted on this site. Such intellectual property remains the property of its respective owners, and any references here are made solely for identification or informational purposes, without implying any affiliation, endorsement, or partnership.
We make no representations or warranties, express or implied, regarding the accuracy, completeness, or suitability of any content or products presented. Nothing on this website should be construed as legal, tax, investment, financial, medical, or other professional advice. In addition, no part of this site—including articles or product references—constitutes a solicitation, recommendation, endorsement, advertisement, or offer to buy or sell any securities, franchises, or other financial instruments, particularly in jurisdictions where such activity would be unlawful.
All content is of a general nature and may not address the specific circumstances of any individual or entity. It is not a substitute for professional advice or services. Any actions you take based on the information provided here are strictly at your own risk. You accept full responsibility for any decisions or outcomes arising from your use of this website and agree to release us from any liability in connection with your use of, or reliance upon, the content or products found herein.