
|
Mercari, Inc. (4385.T) Avaliação DCF |
Totalmente Editável: Adapte-Se Às Suas Necessidades No Excel Ou Planilhas
Design Profissional: Modelos Confiáveis E Padrão Da Indústria
Pré-Construídos Para Uso Rápido E Eficiente
Compatível com MAC/PC, totalmente desbloqueado
Não É Necessária Experiência; Fácil De Seguir
Mercari, Inc. (4385.T) Bundle
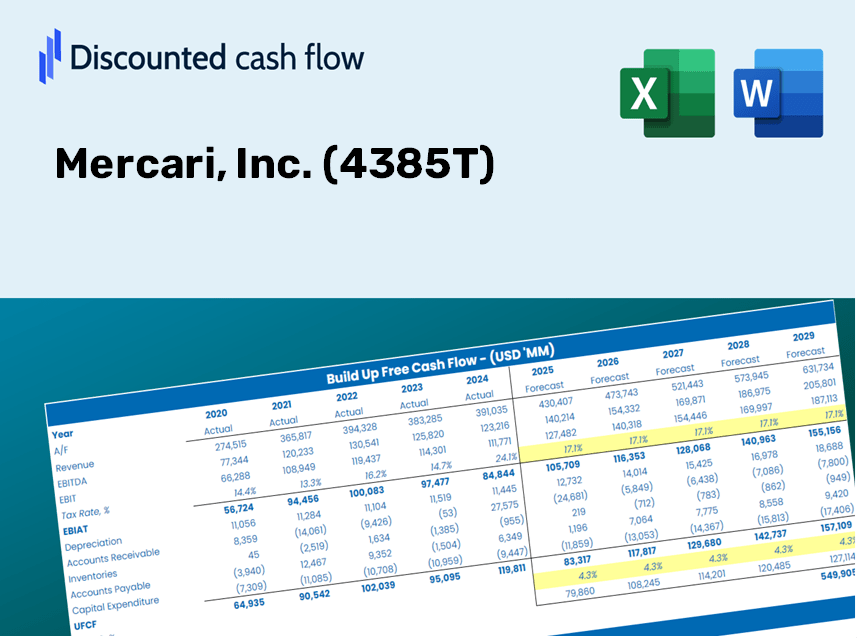
Obtenha uma visão da análise de avaliação Mercari, Inc. (4385T) usando nossa sofisticada calculadora DCF! Este modelo do Excel é pré -carregado com dados reais (4385T), permitindo que você ajuste as previsões e suposições para um cálculo preciso do valor intrínseco da Mercari, Inc..
Discounted Cash Flow (DCF) - (USD MM)
| Year | AY1 2021 |
AY2 2022 |
AY3 2023 |
AY4 2024 |
AY5 2025 |
FY1 2026 |
FY2 2027 |
FY3 2028 |
FY4 2029 |
FY5 2030 |
|---|---|---|---|---|---|---|---|---|---|---|
| Revenue | 106,115.0 | 147,049.0 | 171,967.0 | 187,407.0 | 192,633.0 | 225,037.5 | 262,893.1 | 307,116.6 | 358,779.5 | 419,132.9 |
| Revenue Growth, % | 0 | 38.58 | 16.95 | 8.98 | 2.79 | 16.82 | 16.82 | 16.82 | 16.82 | 16.82 |
| EBITDA | 13,063.0 | -3,039.0 | 19,631.0 | 20,421.0 | 31,620.0 | 22,040.3 | 25,747.9 | 30,079.2 | 35,139.1 | 41,050.2 |
| EBITDA, % | 12.31 | -2.07 | 11.42 | 10.9 | 16.41 | 9.79 | 9.79 | 9.79 | 9.79 | 9.79 |
| Depreciation | 845.0 | 818.0 | 2,745.0 | 2,042.0 | 1,831.0 | 2,245.4 | 2,623.1 | 3,064.4 | 3,579.9 | 4,182.1 |
| Depreciation, % | 0.79631 | 0.55628 | 1.6 | 1.09 | 0.95051 | 0.99779 | 0.99779 | 0.99779 | 0.99779 | 0.99779 |
| EBIT | 12,218.0 | -3,857.0 | 16,886.0 | 18,379.0 | 29,789.0 | 19,794.9 | 23,124.8 | 27,014.9 | 31,559.3 | 36,868.1 |
| EBIT, % | 11.51 | -2.62 | 9.82 | 9.81 | 15.46 | 8.8 | 8.8 | 8.8 | 8.8 | 8.8 |
| Total Cash | 171,463.0 | 218,851.0 | 204,726.0 | 197,305.0 | 147,028.0 | 214,382.2 | 250,445.3 | 292,574.9 | 341,791.6 | 399,287.4 |
| Total Cash, percent | .0 | .0 | .0 | .0 | .0 | .0 | .0 | .0 | .0 | .0 |
| Account Receivables | 46,998.0 | 79,934.0 | 116,633.0 | 195,437.0 | 254,728.0 | 164,939.6 | 192,685.5 | 225,098.9 | 262,964.8 | 307,200.4 |
| Account Receivables, % | 44.29 | 54.36 | 67.82 | 104.28 | 132.23 | 73.29 | 73.29 | 73.29 | 73.29 | 73.29 |
| Inventories | 11,003.0 | 14,705.0 | 10,424.0 | .0 | .0 | 11,895.8 | 13,896.9 | 16,234.6 | 18,965.5 | 22,155.9 |
| Inventories, % | 10.37 | 10 | 6.06 | 0 | 0 | 5.29 | 5.29 | 5.29 | 5.29 | 5.29 |
| Accounts Payable | .0 | 116.0 | 20,862.0 | 21,560.0 | 15,049.0 | 14,189.5 | 16,576.4 | 19,364.9 | 22,622.4 | 26,427.9 |
| Accounts Payable, % | 0 | 0.07888527 | 12.13 | 11.5 | 7.81 | 6.31 | 6.31 | 6.31 | 6.31 | 6.31 |
| Capital Expenditure | -420.0 | -669.0 | -580.0 | -155.0 | -300.0 | -642.0 | -750.0 | -876.2 | -1,023.6 | -1,195.8 |
| Capital Expenditure, % | -0.3958 | -0.45495 | -0.33727 | -0.08270769 | -0.15574 | -0.28529 | -0.28529 | -0.28529 | -0.28529 | -0.28529 |
| Tax Rate, % | 10.32 | 10.32 | 10.32 | 10.32 | 10.32 | 10.32 | 10.32 | 10.32 | 10.32 | 10.32 |
| EBITAT | 5,885.7 | -7,303.9 | 13,507.4 | 13,829.7 | 26,713.9 | 15,562.3 | 18,180.2 | 21,238.5 | 24,811.2 | 28,984.9 |
| Depreciation | ||||||||||
| Changes in Account Receivables | ||||||||||
| Changes in Inventories | ||||||||||
| Changes in Accounts Payable | ||||||||||
| Capital Expenditure | ||||||||||
| UFCF | -51,690.3 | -43,676.9 | 4,000.4 | -51,965.3 | -37,557.1 | 94,198.8 | -7,306.8 | -8,535.9 | -9,971.9 | -11,649.3 |
| WACC, % | 6.12 | 6.77 | 6.52 | 6.46 | 6.64 | 6.5 | 6.5 | 6.5 | 6.5 | 6.5 |
| PV UFCF | ||||||||||
| SUM PV UFCF | 58,687.3 | |||||||||
| Long Term Growth Rate, % | 3.50 | |||||||||
| Free cash flow (T + 1) | -12,057 | |||||||||
| Terminal Value | -401,692 | |||||||||
| Present Terminal Value | -293,166 | |||||||||
| Enterprise Value | -234,479 | |||||||||
| Net Debt | 52,347 | |||||||||
| Equity Value | -286,826 | |||||||||
| Diluted Shares Outstanding, MM | 169 | |||||||||
| Equity Value Per Share | -1,700.83 |
What You Will Receive
- Genuine [Symbol] Financial Data: Pre-filled with Mercari’s historical and projected figures for accurate analysis.
- Completely Customizable Template: Easily adjust key inputs such as revenue growth, WACC, and EBITDA percentage.
- Instant Calculations: Watch Mercari’s intrinsic value refresh immediately as you make adjustments.
- Premium Valuation Tool: Crafted for investors, analysts, and consultants aiming for precise DCF outcomes.
- Intuitive Design: Streamlined layout and straightforward instructions suitable for all skill levels.
Key Features
- Pre-Loaded Data: Mercari’s historical financial statements and pre-filled forecasts.
- Fully Adjustable Inputs: Customize WACC, tax rates, revenue growth, and EBITDA margins.
- Instant Results: View Mercari’s intrinsic value as it updates in real time.
- Clear Visual Outputs: Dashboard charts showcase valuation results and essential metrics.
- Built for Accuracy: A professional tool designed for analysts, investors, and finance professionals.
How It Works
- Step 1: Download the Excel file.
- Step 2: Review the pre-filled Mercari, Inc. ([4385T]) data (historical and projected).
- Step 3: Modify key assumptions (highlighted in yellow) according to your analysis.
- Step 4: Observe automatic recalculations of Mercari, Inc.'s ([4385T]) intrinsic value.
- Step 5: Utilize the results for investment strategies or reporting purposes.
Why Choose This Calculator for Mercari, Inc. (4385T)?
- Designed for Experts: A sophisticated tool utilized by market analysts, financial officers, and consultants.
- Real-Time Data: Mercari’s historical and future financial data preloaded for enhanced precision.
- Scenario Analysis: Effortlessly model various projections and hypotheses.
- Transparent Results: Automatically determines intrinsic value, NPV, and critical financial metrics.
- User-Friendly: Comprehensive step-by-step guidance helps you navigate the tool with ease.
Who Should Use Mercari, Inc. (4385T)?
- Individual Investors: Make well-informed choices regarding the purchase or sale of Mercari, Inc. (4385T) shares.
- Financial Analysts: Enhance your valuation processes with readily available financial models specific to Mercari, Inc. (4385T).
- Consultants: Provide clients with accurate and timely valuation insights related to Mercari, Inc. (4385T).
- Business Owners: Learn how leading companies like Mercari, Inc. (4385T) are valued to inform your own business strategy.
- Finance Students: Gain practical knowledge of valuation techniques by analyzing real-world data and case studies involving Mercari, Inc. (4385T).
Contents of the Template
- Pre-Filled DCF Model: Mercari's financial data preloaded for immediate application.
- WACC Calculator: Comprehensive calculations for Weighted Average Cost of Capital.
- Financial Ratios: Assess Mercari's profitability, leverage, and operational efficiency.
- Editable Inputs: Modify assumptions such as growth rates, margins, and CAPEX to suit your analyses.
- Financial Statements: Annual and quarterly reports for in-depth evaluation.
- Interactive Dashboard: Effortlessly visualize essential valuation metrics and outcomes.
Disclaimer
All information, articles, and product details provided on this website are for general informational and educational purposes only. We do not claim any ownership over, nor do we intend to infringe upon, any trademarks, copyrights, logos, brand names, or other intellectual property mentioned or depicted on this site. Such intellectual property remains the property of its respective owners, and any references here are made solely for identification or informational purposes, without implying any affiliation, endorsement, or partnership.
We make no representations or warranties, express or implied, regarding the accuracy, completeness, or suitability of any content or products presented. Nothing on this website should be construed as legal, tax, investment, financial, medical, or other professional advice. In addition, no part of this site—including articles or product references—constitutes a solicitation, recommendation, endorsement, advertisement, or offer to buy or sell any securities, franchises, or other financial instruments, particularly in jurisdictions where such activity would be unlawful.
All content is of a general nature and may not address the specific circumstances of any individual or entity. It is not a substitute for professional advice or services. Any actions you take based on the information provided here are strictly at your own risk. You accept full responsibility for any decisions or outcomes arising from your use of this website and agree to release us from any liability in connection with your use of, or reliance upon, the content or products found herein.