
|
Kao Corporation (4452.T) Avaliação DCF |
Totalmente Editável: Adapte-Se Às Suas Necessidades No Excel Ou Planilhas
Design Profissional: Modelos Confiáveis E Padrão Da Indústria
Pré-Construídos Para Uso Rápido E Eficiente
Compatível com MAC/PC, totalmente desbloqueado
Não É Necessária Experiência; Fácil De Seguir
Kao Corporation (4452.T) Bundle
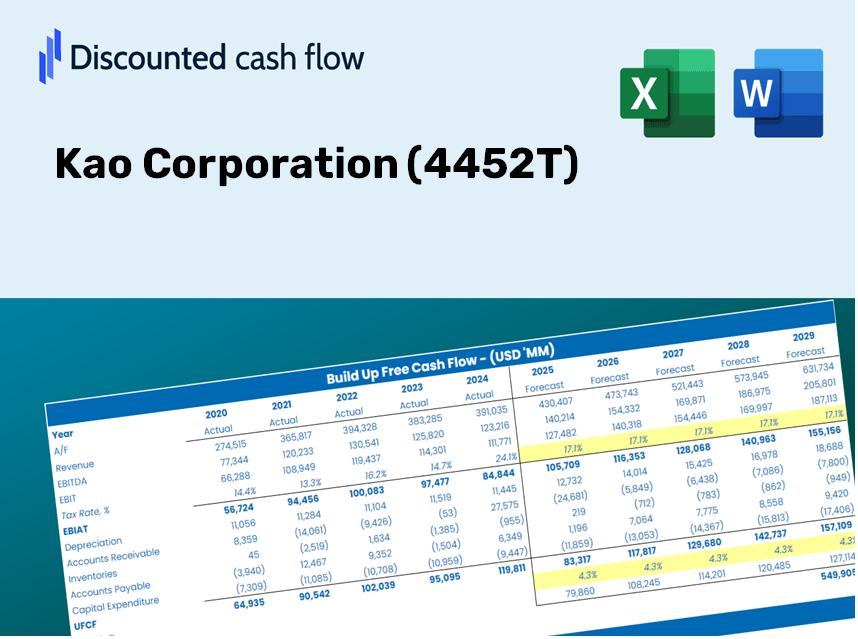
Avalie a perspectiva financeira da Kao Corporation (4452T) com precisão especializada! Esta calculadora DCF (4452T) vem com finanças pré-populadas e oferece total flexibilidade para modificar o crescimento da receita, o WACC, as margens e outras suposições cruciais para se alinhar às suas projeções.
What You Will Receive
- Genuine Kao Corporation Financials: Offers historical and projected data for precise valuation.
- Customizable Inputs: Adjust WACC, tax rates, revenue growth, and capital expenditures as needed.
- Real-Time Calculations: Automatic computation of intrinsic value and NPV.
- Scenario Evaluation: Analyze various scenarios to assess Kao Corporation’s future performance.
- User-Friendly Design: Designed for professionals but easy enough for newcomers to understand.
Key Features
- Comprehensive Kao Data: Pre-loaded with Kao Corporation's historical financial performance and future estimates.
- Fully Customizable Parameters: Modify revenue growth rates, profit margins, WACC, tax rates, and capital expenditures as needed.
- Dynamic Valuation Framework: Automatically refreshes Net Present Value (NPV) and intrinsic value according to your specified inputs.
- Scenario Analysis: Develop multiple forecasting scenarios to evaluate various valuation results.
- User-Friendly Interface: Designed to be intuitive and accessible for both experienced professionals and newcomers.
How It Works
- Step 1: Download the Excel file.
- Step 2: Review Kao Corporation's (4452T) pre-filled financial data and forecasts.
- Step 3: Adjust key inputs such as revenue growth, WACC, and tax rates (highlighted cells).
- Step 4: Observe the DCF model update in real-time as you modify assumptions.
- Step 5: Evaluate the outputs and leverage the results for your investment choices.
Why Choose This Calculator for Kao Corporation (4452T)?
- Precision: Utilizes authentic Kao Corporation financial data to guarantee accuracy.
- Versatility: Built for users to experiment and adjust inputs as needed.
- Efficiency: Avoid the complexities of creating a DCF model from the ground up.
- High-Quality: Crafted with the expertise and attention to detail expected from top financial professionals.
- User-Centric: Designed for simplicity, making it accessible even for those without extensive financial modeling skills.
Who Can Benefit from This Product?
- Investors: Gain a precise valuation of Kao Corporation's fair market value before taking investment actions.
- CFOs: Utilize a sophisticated DCF model for enhanced financial reporting and analysis.
- Consultants: Easily modify the template to create valuation reports for their clients.
- Entrepreneurs: Discover the financial modeling techniques employed by industry leaders.
- Educators: Employ it as a resource for teaching valuation principles and methodologies.
Contents of the Template
- Preloaded KAO Data: Historical and projected financial information, including revenue, EBIT, and capital expenditures.
- DCF and WACC Models: High-quality sheets designed for calculating intrinsic value and Weighted Average Cost of Capital.
- Editable Inputs: Cells highlighted in yellow for modifying revenue growth, tax rates, and discount rates.
- Financial Statements: Detailed annual and quarterly financial reports for in-depth analysis.
- Key Ratios: Metrics for profitability, leverage, and efficiency to assess performance.
- Dashboard and Charts: Visual representations of valuation results and underlying assumptions.
Disclaimer
All information, articles, and product details provided on this website are for general informational and educational purposes only. We do not claim any ownership over, nor do we intend to infringe upon, any trademarks, copyrights, logos, brand names, or other intellectual property mentioned or depicted on this site. Such intellectual property remains the property of its respective owners, and any references here are made solely for identification or informational purposes, without implying any affiliation, endorsement, or partnership.
We make no representations or warranties, express or implied, regarding the accuracy, completeness, or suitability of any content or products presented. Nothing on this website should be construed as legal, tax, investment, financial, medical, or other professional advice. In addition, no part of this site—including articles or product references—constitutes a solicitation, recommendation, endorsement, advertisement, or offer to buy or sell any securities, franchises, or other financial instruments, particularly in jurisdictions where such activity would be unlawful.
All content is of a general nature and may not address the specific circumstances of any individual or entity. It is not a substitute for professional advice or services. Any actions you take based on the information provided here are strictly at your own risk. You accept full responsibility for any decisions or outcomes arising from your use of this website and agree to release us from any liability in connection with your use of, or reliance upon, the content or products found herein.