
|
Medley, Inc. (4480.T) Avaliação DCF |
Totalmente Editável: Adapte-Se Às Suas Necessidades No Excel Ou Planilhas
Design Profissional: Modelos Confiáveis E Padrão Da Indústria
Pré-Construídos Para Uso Rápido E Eficiente
Compatível com MAC/PC, totalmente desbloqueado
Não É Necessária Experiência; Fácil De Seguir
Medley, Inc. (4480.T) Bundle
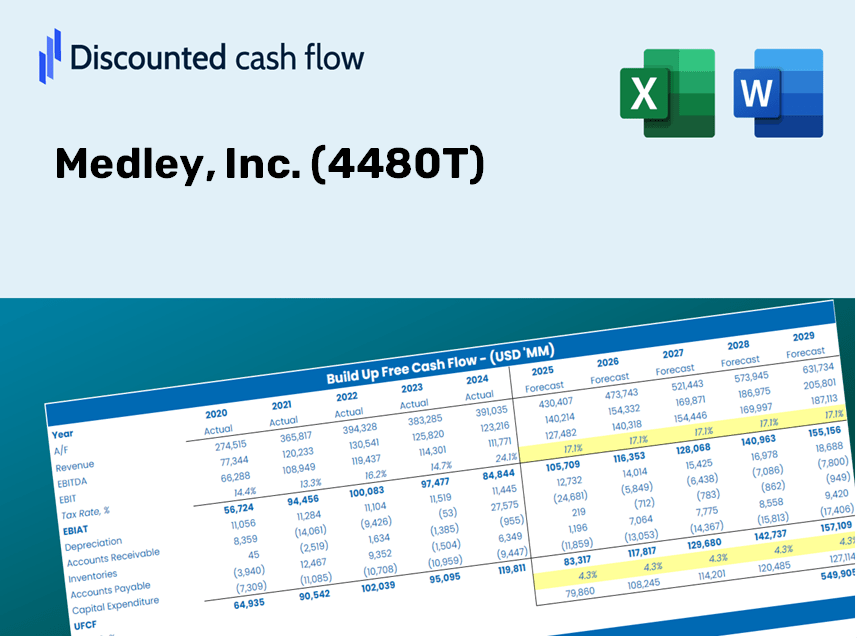
Seja você um investidor ou analista, esta calculadora DCF (4480T) é o seu recurso preferido para uma avaliação precisa. Pré -carregado com dados da Medley, Inc., você pode ajustar as previsões e observar os efeitos em tempo real.
Discounted Cash Flow (DCF) - (USD MM)
| Year | AY1 2020 |
AY2 2021 |
AY3 2022 |
AY4 2023 |
AY5 2024 |
FY1 2025 |
FY2 2026 |
FY3 2027 |
FY4 2028 |
FY5 2029 |
|---|---|---|---|---|---|---|---|---|---|---|
| Revenue | 6,830.8 | 10,863.6 | 14,185.0 | 20,532.0 | 29,302.0 | 33,426.0 | 38,130.3 | 43,496.8 | 49,618.6 | 56,601.9 |
| Revenue Growth, % | 0 | 59.04 | 30.57 | 44.74 | 42.71 | 14.07 | 14.07 | 14.07 | 14.07 | 14.07 |
| EBITDA | 586.6 | 1,248.5 | 2,137.0 | 4,499.0 | 4,004.0 | 4,727.9 | 5,393.3 | 6,152.3 | 7,018.2 | 8,006.0 |
| EBITDA, % | 8.59 | 11.49 | 15.07 | 21.91 | 13.66 | 14.14 | 14.14 | 14.14 | 14.14 | 14.14 |
| Depreciation | 153.8 | 464.9 | 600.0 | 686.0 | 1,676.0 | 1,325.1 | 1,511.6 | 1,724.4 | 1,967.1 | 2,243.9 |
| Depreciation, % | 2.25 | 4.28 | 4.23 | 3.34 | 5.72 | 3.96 | 3.96 | 3.96 | 3.96 | 3.96 |
| EBIT | 432.8 | 783.6 | 1,537.0 | 3,813.0 | 2,328.0 | 3,402.8 | 3,881.7 | 4,428.0 | 5,051.2 | 5,762.1 |
| EBIT, % | 6.34 | 7.21 | 10.84 | 18.57 | 7.94 | 10.18 | 10.18 | 10.18 | 10.18 | 10.18 |
| Total Cash | 14,052.0 | 14,294.5 | 14,422.0 | 15,354.0 | 18,996.0 | 29,388.7 | 33,524.9 | 38,243.2 | 43,625.6 | 49,765.4 |
| Total Cash, percent | .0 | .0 | .0 | .0 | .0 | .0 | .0 | .0 | .0 | .0 |
| Account Receivables | 271.3 | 829.0 | 1,238.0 | 2,949.0 | 5,728.0 | 3,626.2 | 4,136.5 | 4,718.7 | 5,382.8 | 6,140.4 |
| Account Receivables, % | 3.97 | 7.63 | 8.73 | 14.36 | 19.55 | 10.85 | 10.85 | 10.85 | 10.85 | 10.85 |
| Inventories | 16.0 | 42.5 | 166.0 | 283.0 | 272.0 | 274.2 | 312.8 | 356.9 | 407.1 | 464.4 |
| Inventories, % | 0.23416 | 0.39101 | 1.17 | 1.38 | 0.92826 | 0.8204 | 0.8204 | 0.8204 | 0.8204 | 0.8204 |
| Accounts Payable | 57.3 | 109.0 | 272.0 | 317.0 | 407.0 | 447.4 | 510.4 | 582.2 | 664.1 | 757.6 |
| Accounts Payable, % | 0.83866 | 1 | 1.92 | 1.54 | 1.39 | 1.34 | 1.34 | 1.34 | 1.34 | 1.34 |
| Capital Expenditure | -213.9 | -242.5 | -378.0 | -403.0 | -66.0 | -683.0 | -779.1 | -888.8 | -1,013.9 | -1,156.6 |
| Capital Expenditure, % | -3.13 | -2.23 | -2.66 | -1.96 | -0.22524 | -2.04 | -2.04 | -2.04 | -2.04 | -2.04 |
| Tax Rate, % | 31.24 | 31.24 | 31.24 | 31.24 | 31.24 | 31.24 | 31.24 | 31.24 | 31.24 | 31.24 |
| EBITAT | 466.9 | 576.8 | 1,026.3 | 2,573.4 | 1,600.8 | 2,563.2 | 2,924.0 | 3,335.5 | 3,804.9 | 4,340.4 |
| Depreciation | ||||||||||
| Changes in Account Receivables | ||||||||||
| Changes in Inventories | ||||||||||
| Changes in Accounts Payable | ||||||||||
| Capital Expenditure | ||||||||||
| UFCF | 176.8 | 266.8 | 878.8 | 1,073.4 | 532.8 | 5,345.4 | 3,170.5 | 3,616.7 | 4,125.7 | 4,706.4 |
| WACC, % | 6.33 | 6.21 | 6.17 | 6.18 | 6.18 | 6.21 | 6.21 | 6.21 | 6.21 | 6.21 |
| PV UFCF | ||||||||||
| SUM PV UFCF | 17,584.9 | |||||||||
| Long Term Growth Rate, % | 4.00 | |||||||||
| Free cash flow (T + 1) | 4,895 | |||||||||
| Terminal Value | 221,122 | |||||||||
| Present Terminal Value | 163,581 | |||||||||
| Enterprise Value | 181,166 | |||||||||
| Net Debt | -3,812 | |||||||||
| Equity Value | 184,978 | |||||||||
| Diluted Shares Outstanding, MM | 33 | |||||||||
| Equity Value Per Share | 5,659.83 |
What You Will Receive
- Accurate Medley Financials: Access to both historical and projected data for precise valuation.
- Customizable Inputs: Adjust WACC, tax rates, revenue growth, and capital expenditures as needed.
- Dynamically Generated Calculations: Intrinsic value and NPV computed in real-time.
- Comprehensive Scenario Analysis: Evaluate various scenarios to assess Medley’s future performance.
- User-Friendly Design: Crafted for professionals but easy to navigate for newcomers.
Key Features
- Comprehensive Historical Data: Medley, Inc.’s financial statements along with pre-filled projections.
- Customizable Parameters: Adjust inputs for WACC, tax rates, revenue growth, and EBITDA margins.
- Real-Time Valuation: Watch the intrinsic value for Medley, Inc. recalibrate instantly.
- Visual Performance Metrics: Dashboard charts present valuation outcomes and essential metrics.
- Designed for Precision: A professional-grade tool tailored for analysts, investors, and finance professionals.
How It Works
- Step 1: Download the Excel file.
- Step 2: Examine Medley, Inc.'s (4480T) pre-filled financial data and projections.
- Step 3: Adjust key inputs such as revenue growth, WACC, and tax rates (cells highlighted for your convenience).
- Step 4: Observe the DCF model refresh in real-time as you modify your assumptions.
- Step 5: Review the outputs and leverage the findings for your investment strategies.
Why Choose This Calculator for Medley, Inc. (4480T)?
- Designed for Experts: A sophisticated tool utilized by financial analysts, CFOs, and strategic consultants.
- Accurate Data: Medley, Inc.’s historical and forecasted financials are preloaded for precision.
- Flexible Scenario Analysis: Effortlessly test various predictions and assumptions.
- Comprehensive Outputs: Instantly calculates intrinsic value, NPV, and critical financial metrics.
- User-Friendly: Follow straightforward, step-by-step instructions throughout the calculation process.
Who Should Use Medley, Inc. (4480T)?
- Individual Investors: Make informed decisions about buying or selling Medley, Inc. (4480T) stock.
- Financial Analysts: Enhance valuation processes with comprehensive financial models tailored for Medley, Inc. (4480T).
- Consultants: Provide clients with precise valuation insights on Medley, Inc. (4480T) swiftly and effectively.
- Business Owners: Gain insights into how firms like Medley, Inc. (4480T) are valued to inform your business strategy.
- Finance Students: Discover valuation methods through real-world examples and data focused on Medley, Inc. (4480T).
What the Template Includes
- Preloaded MDLY Data: Historical and forecasted financial metrics, such as revenue, EBIT, and capital expenditures.
- DCF and WACC Models: Advanced sheets designed for calculating intrinsic value and Weighted Average Cost of Capital.
- Editable Inputs: Cells highlighted in yellow for easy adjustments to revenue growth, tax rates, and discount rates.
- Financial Statements: Detailed annual and quarterly financial reports for thorough analysis.
- Key Ratios: Metrics for profitability, leverage, and efficiency to assess performance.
- Dashboard and Charts: Visual representations of valuation results and underlying assumptions.
Disclaimer
All information, articles, and product details provided on this website are for general informational and educational purposes only. We do not claim any ownership over, nor do we intend to infringe upon, any trademarks, copyrights, logos, brand names, or other intellectual property mentioned or depicted on this site. Such intellectual property remains the property of its respective owners, and any references here are made solely for identification or informational purposes, without implying any affiliation, endorsement, or partnership.
We make no representations or warranties, express or implied, regarding the accuracy, completeness, or suitability of any content or products presented. Nothing on this website should be construed as legal, tax, investment, financial, medical, or other professional advice. In addition, no part of this site—including articles or product references—constitutes a solicitation, recommendation, endorsement, advertisement, or offer to buy or sell any securities, franchises, or other financial instruments, particularly in jurisdictions where such activity would be unlawful.
All content is of a general nature and may not address the specific circumstances of any individual or entity. It is not a substitute for professional advice or services. Any actions you take based on the information provided here are strictly at your own risk. You accept full responsibility for any decisions or outcomes arising from your use of this website and agree to release us from any liability in connection with your use of, or reliance upon, the content or products found herein.