
|
Sumitomo Pharma Co., Ltd. (4506.T) Avaliação DCF |
Totalmente Editável: Adapte-Se Às Suas Necessidades No Excel Ou Planilhas
Design Profissional: Modelos Confiáveis E Padrão Da Indústria
Pré-Construídos Para Uso Rápido E Eficiente
Compatível com MAC/PC, totalmente desbloqueado
Não É Necessária Experiência; Fácil De Seguir
Sumitomo Pharma Co., Ltd. (4506.T) Bundle
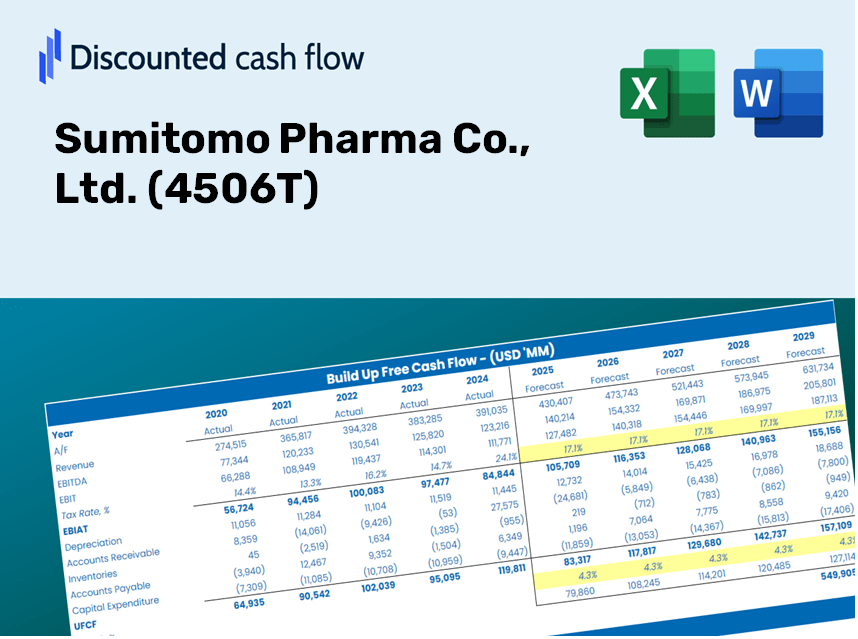
Projetado para precisão, nossa calculadora DCF [4506T] o capacita a avaliar a avaliação da Sumitomo Pharma Co., Ltd. usando dados financeiros do mundo real, oferecendo completa flexibilidade para modificar todos os parâmetros essenciais para projeções aprimoradas.
Discounted Cash Flow (DCF) - (USD MM)
| Year | AY1 2021 |
AY2 2022 |
AY3 2023 |
AY4 2024 |
AY5 2025 |
FY1 2026 |
FY2 2027 |
FY3 2028 |
FY4 2029 |
FY5 2030 |
|---|---|---|---|---|---|---|---|---|---|---|
| Revenue | 515,952.0 | 560,035.0 | 555,544.0 | 314,558.0 | 398,832.0 | 390,012.8 | 381,388.6 | 372,955.1 | 364,708.1 | 356,643.4 |
| Revenue Growth, % | 0 | 8.54 | -0.80191 | -43.38 | 26.79 | -2.21 | -2.21 | -2.21 | -2.21 | -2.21 |
| EBITDA | 103,110.0 | 124,359.0 | -3,498.0 | -281,072.0 | 56,673.0 | -26,196.8 | -25,617.5 | -25,051.0 | -24,497.1 | -23,955.4 |
| EBITDA, % | 19.98 | 22.21 | -0.62965 | -89.35 | 14.21 | -6.72 | -6.72 | -6.72 | -6.72 | -6.72 |
| Depreciation | 22,673.0 | 38,348.0 | 41,263.0 | 37,765.0 | 25,562.0 | 28,926.7 | 28,287.0 | 27,661.5 | 27,049.9 | 26,451.7 |
| Depreciation, % | 4.39 | 6.85 | 7.43 | 12.01 | 6.41 | 7.42 | 7.42 | 7.42 | 7.42 | 7.42 |
| EBIT | 80,437.0 | 86,011.0 | -44,761.0 | -318,837.0 | 31,111.0 | -54,062.4 | -52,866.9 | -51,697.9 | -50,554.7 | -49,436.8 |
| EBIT, % | 15.59 | 15.36 | -8.06 | -101.36 | 7.8 | -13.86 | -13.86 | -13.86 | -13.86 | -13.86 |
| Total Cash | 193,698.0 | 202,984.0 | 143,478.0 | 36,132.0 | 39,956.0 | 94,475.3 | 92,386.2 | 90,343.3 | 88,345.5 | 86,392.0 |
| Total Cash, percent | .0 | .0 | .0 | .0 | .0 | .0 | .0 | .0 | .0 | .0 |
| Account Receivables | 135,866.0 | 151,407.0 | 95,908.0 | 97,239.0 | 74,840.0 | 93,844.7 | 91,769.6 | 89,740.3 | 87,755.9 | 85,815.4 |
| Account Receivables, % | 26.33 | 27.04 | 17.26 | 30.91 | 18.76 | 24.06 | 24.06 | 24.06 | 24.06 | 24.06 |
| Inventories | 92,215.0 | 99,021.0 | 94,405.0 | 115,350.0 | 94,222.0 | 88,019.8 | 86,073.5 | 84,170.2 | 82,309.0 | 80,488.9 |
| Inventories, % | 17.87 | 17.68 | 16.99 | 36.67 | 23.62 | 22.57 | 22.57 | 22.57 | 22.57 | 22.57 |
| Accounts Payable | 26,076.0 | 22,455.0 | 13,403.0 | 67,720.0 | 38,544.0 | 33,282.9 | 32,546.9 | 31,827.2 | 31,123.4 | 30,435.2 |
| Accounts Payable, % | 5.05 | 4.01 | 2.41 | 21.53 | 9.66 | 8.53 | 8.53 | 8.53 | 8.53 | 8.53 |
| Capital Expenditure | -10,806.0 | -13,494.0 | -12,742.0 | -15,730.0 | -13,030.0 | -11,751.2 | -11,491.4 | -11,237.3 | -10,988.8 | -10,745.8 |
| Capital Expenditure, % | -2.09 | -2.41 | -2.29 | -5 | -3.27 | -3.01 | -3.01 | -3.01 | -3.01 | -3.01 |
| Tax Rate, % | -34.2 | -34.2 | -34.2 | -34.2 | -34.2 | -34.2 | -34.2 | -34.2 | -34.2 | -34.2 |
| EBITAT | 58,086.4 | 58,487.0 | -69,600.0 | -310,799.8 | 41,751.0 | -47,325.4 | -46,278.9 | -45,255.5 | -44,254.8 | -43,276.2 |
| Depreciation | ||||||||||
| Changes in Account Receivables | ||||||||||
| Changes in Inventories | ||||||||||
| Changes in Accounts Payable | ||||||||||
| Capital Expenditure | ||||||||||
| UFCF | -132,051.6 | 57,373.0 | 9,984.0 | -256,723.8 | 68,634.0 | -48,213.6 | -26,197.7 | -25,618.4 | -25,051.9 | -24,497.9 |
| WACC, % | 5.33 | 5.27 | 5.71 | 5.67 | 5.71 | 5.54 | 5.54 | 5.54 | 5.54 | 5.54 |
| PV UFCF | ||||||||||
| SUM PV UFCF | -129,897.4 | |||||||||
| Long Term Growth Rate, % | 2.00 | |||||||||
| Free cash flow (T + 1) | -24,988 | |||||||||
| Terminal Value | -706,032 | |||||||||
| Present Terminal Value | -539,207 | |||||||||
| Enterprise Value | -669,104 | |||||||||
| Net Debt | 282,306 | |||||||||
| Equity Value | -951,410 | |||||||||
| Diluted Shares Outstanding, MM | 397 | |||||||||
| Equity Value Per Share | -2,394.75 |
What You Will Receive
- Genuine Sumitomo Pharma Data: Comprehensive financials – from revenue to EBIT – based on actual and projected figures.
- Complete Customization: Modify all essential parameters (yellow cells) such as WACC, growth %, and tax rates.
- Real-Time Valuation Updates: Automatic recalculations to assess the impact of changes on Sumitomo Pharma’s fair value.
- Dynamic Excel Template: Designed for quick modifications, scenario analysis, and detailed forecasting.
- Efficient and Precise: Eliminate the need to build models from the ground up while ensuring accuracy and adaptability.
Key Features
- Customizable Forecast Inputs: Adjust essential factors such as revenue growth, EBITDA %, and capital expenditures.
- Instant DCF Valuation: Quickly calculates intrinsic value, NPV, and other financial metrics.
- High-Precision Accuracy: Leverages Sumitomo Pharma's real-world financial data for reliable valuation results.
- Effortless Scenario Analysis: Easily test varying assumptions and assess results side by side.
- Efficiency Booster: Remove the hassle of constructing intricate valuation models from the ground up.
How It Works
- Step 1: Download the Excel file.
- Step 2: Examine Sumitomo Pharma Co., Ltd.'s (4506T) pre-filled financial data and projections.
- Step 3: Adjust key inputs such as revenue growth, WACC, and tax rates (cells highlighted for your convenience).
- Step 4: Observe as the DCF model updates in real-time with your modifications.
- Step 5: Evaluate the output and leverage the results for your investment choices.
Why Choose This Calculator for Sumitomo Pharma Co., Ltd. (4506T)?
- Reliable Information: Accurate financial data from Sumitomo Pharma ensures trustworthy valuation outcomes.
- Customizable Options: Tailor essential parameters such as growth rates, WACC, and tax rates to fit your forecasts.
- Efficiency Boost: Ready-to-use calculations save you time and effort.
- Professional Tool: Ideal for investors, analysts, and consultants working with pharmaceuticals.
- Easy to Use: User-friendly interface and guided instructions cater to users of all experience levels.
Who Should Use This Product?
- Investors: Accurately assess Sumitomo Pharma's fair value before making investment choices.
- CFOs: Utilize a professional-grade DCF model for precise financial reporting and analysis.
- Consultants: Efficiently customize the template for client valuation reports.
- Entrepreneurs: Discover insights into financial modeling practices employed by industry leaders.
- Educators: Implement it as a teaching resource to illustrate various valuation methodologies.
Contents of the Template
- Pre-Filled Data: Contains Sumitomo Pharma's historical financials and projections.
- Discounted Cash Flow Model: An editable DCF valuation model with automated calculations.
- Weighted Average Cost of Capital (WACC): A specific sheet for WACC calculation using custom inputs.
- Key Financial Ratios: Assess Sumitomo Pharma's profitability, efficiency, and financial leverage.
- Customizable Inputs: Easily adjust revenue growth, profit margins, and tax rates.
- Clear Dashboard: Visual representations and tables summarizing essential valuation outcomes.
Disclaimer
All information, articles, and product details provided on this website are for general informational and educational purposes only. We do not claim any ownership over, nor do we intend to infringe upon, any trademarks, copyrights, logos, brand names, or other intellectual property mentioned or depicted on this site. Such intellectual property remains the property of its respective owners, and any references here are made solely for identification or informational purposes, without implying any affiliation, endorsement, or partnership.
We make no representations or warranties, express or implied, regarding the accuracy, completeness, or suitability of any content or products presented. Nothing on this website should be construed as legal, tax, investment, financial, medical, or other professional advice. In addition, no part of this site—including articles or product references—constitutes a solicitation, recommendation, endorsement, advertisement, or offer to buy or sell any securities, franchises, or other financial instruments, particularly in jurisdictions where such activity would be unlawful.
All content is of a general nature and may not address the specific circumstances of any individual or entity. It is not a substitute for professional advice or services. Any actions you take based on the information provided here are strictly at your own risk. You accept full responsibility for any decisions or outcomes arising from your use of this website and agree to release us from any liability in connection with your use of, or reliance upon, the content or products found herein.