
|
Ono Pharmaceutical Co., Ltd. (4528.T) Avaliação DCF |
Totalmente Editável: Adapte-Se Às Suas Necessidades No Excel Ou Planilhas
Design Profissional: Modelos Confiáveis E Padrão Da Indústria
Pré-Construídos Para Uso Rápido E Eficiente
Compatível com MAC/PC, totalmente desbloqueado
Não É Necessária Experiência; Fácil De Seguir
Ono Pharmaceutical Co., Ltd. (4528.T) Bundle
Seja você um investidor ou analista, esta calculadora DCF (4528T) é a ferramenta perfeita para uma avaliação precisa. Com dados reais da Ono Pharmaceutical Co., Ltd., você pode ajustar as previsões e observar instantaneamente os efeitos.
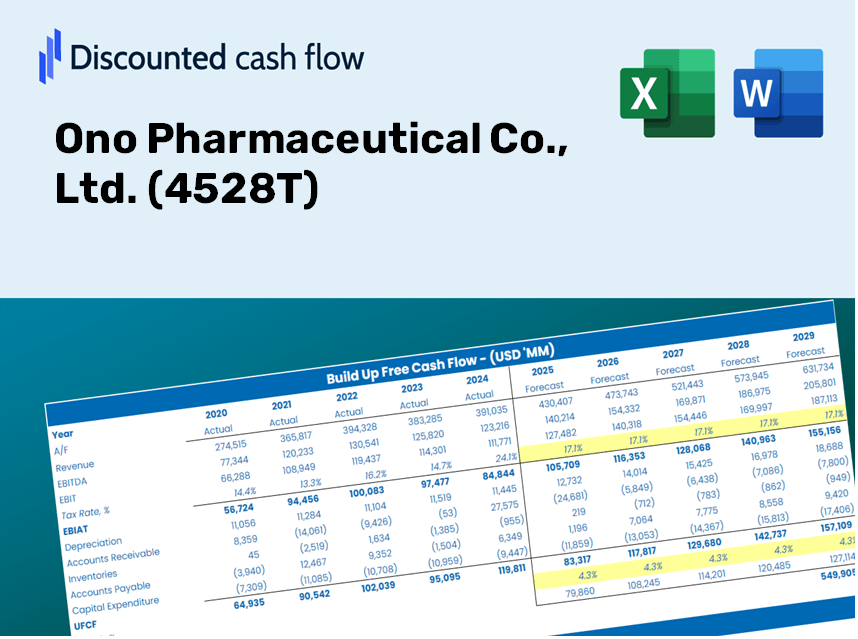
Discounted Cash Flow (DCF) - (USD MM)
| Year | AY1 2021 |
AY2 2022 |
AY3 2023 |
AY4 2024 |
AY5 2025 |
FY1 2026 |
FY2 2027 |
FY3 2028 |
FY4 2029 |
FY5 2030 |
|---|---|---|---|---|---|---|---|---|---|---|
| Revenue | 309,284.0 | 361,361.0 | 447,187.0 | 502,672.0 | 486,871.0 | 547,550.8 | 615,793.2 | 692,540.8 | 778,853.6 | 875,923.8 |
| Revenue Growth, % | 0 | 16.84 | 23.75 | 12.41 | -3.14 | 12.46 | 12.46 | 12.46 | 12.46 | 12.46 |
| EBITDA | 116,847.0 | 122,827.0 | 161,896.0 | 182,103.0 | 91,540.0 | 178,503.6 | 200,750.8 | 225,770.9 | 253,909.2 | 285,554.4 |
| EBITDA, % | 37.78 | 33.99 | 36.2 | 36.23 | 18.8 | 32.6 | 32.6 | 32.6 | 32.6 | 32.6 |
| Depreciation | 15,820.0 | 17,721.0 | 17,451.0 | 18,140.0 | 26,894.0 | 25,246.4 | 28,392.9 | 31,931.6 | 35,911.3 | 40,387.0 |
| Depreciation, % | 5.12 | 4.9 | 3.9 | 3.61 | 5.52 | 4.61 | 4.61 | 4.61 | 4.61 | 4.61 |
| EBIT | 101,027.0 | 105,106.0 | 144,445.0 | 163,963.0 | 64,646.0 | 153,257.1 | 172,357.9 | 193,839.2 | 217,997.8 | 245,167.4 |
| EBIT, % | 32.66 | 29.09 | 32.3 | 32.62 | 13.28 | 27.99 | 27.99 | 27.99 | 27.99 | 27.99 |
| Total Cash | 104,975.0 | 116,969.0 | 164,289.0 | 204,595.0 | 210,380.0 | 204,741.0 | 230,258.3 | 258,955.9 | 291,230.1 | 327,526.7 |
| Total Cash, percent | .0 | .0 | .0 | .0 | .0 | .0 | .0 | .0 | .0 | .0 |
| Account Receivables | 84,269.0 | 99,788.0 | 114,396.0 | 136,066.0 | 135,022.0 | 148,105.2 | 166,563.9 | 187,323.1 | 210,669.6 | 236,925.8 |
| Account Receivables, % | 27.25 | 27.61 | 25.58 | 27.07 | 27.73 | 27.05 | 27.05 | 27.05 | 27.05 | 27.05 |
| Inventories | 39,151.0 | 41,817.0 | 44,814.0 | 48,629.0 | 74,864.0 | 64,942.4 | 73,036.3 | 82,139.0 | 92,376.2 | 103,889.2 |
| Inventories, % | 12.66 | 11.57 | 10.02 | 9.67 | 15.38 | 11.86 | 11.86 | 11.86 | 11.86 | 11.86 |
| Accounts Payable | 39,163.0 | 49,689.0 | 66,794.0 | 60,691.0 | 89,329.0 | 78,596.2 | 88,391.8 | 99,408.3 | 111,797.8 | 125,731.4 |
| Accounts Payable, % | 12.66 | 13.75 | 14.94 | 12.07 | 18.35 | 14.35 | 14.35 | 14.35 | 14.35 | 14.35 |
| Capital Expenditure | -20,293.0 | -12,277.0 | -14,497.0 | -20,829.0 | -7,990.0 | -20,790.8 | -23,382.0 | -26,296.2 | -29,573.5 | -33,259.3 |
| Capital Expenditure, % | -6.56 | -3.4 | -3.24 | -4.14 | -1.64 | -3.8 | -3.8 | -3.8 | -3.8 | -3.8 |
| Tax Rate, % | 15.64 | 15.64 | 15.64 | 15.64 | 15.64 | 15.64 | 15.64 | 15.64 | 15.64 | 15.64 |
| EBITAT | 75,527.4 | 80,581.1 | 113,440.0 | 128,156.0 | 54,533.1 | 120,300.5 | 135,293.8 | 152,155.8 | 171,119.3 | 192,446.2 |
| Depreciation | ||||||||||
| Changes in Account Receivables | ||||||||||
| Changes in Inventories | ||||||||||
| Changes in Accounts Payable | ||||||||||
| Capital Expenditure | ||||||||||
| UFCF | -13,202.6 | 78,366.1 | 115,894.0 | 93,879.0 | 76,884.1 | 110,861.7 | 123,547.8 | 138,945.8 | 156,262.9 | 175,738.3 |
| WACC, % | 4.27 | 4.28 | 4.29 | 4.28 | 4.32 | 4.29 | 4.29 | 4.29 | 4.29 | 4.29 |
| PV UFCF | ||||||||||
| SUM PV UFCF | 617,005.7 | |||||||||
| Long Term Growth Rate, % | 0.50 | |||||||||
| Free cash flow (T + 1) | 176,617 | |||||||||
| Terminal Value | 4,665,076 | |||||||||
| Present Terminal Value | 3,782,073 | |||||||||
| Enterprise Value | 4,399,079 | |||||||||
| Net Debt | -57,889 | |||||||||
| Equity Value | 4,456,968 | |||||||||
| Diluted Shares Outstanding, MM | 470 | |||||||||
| Equity Value Per Share | 9,487.59 |
What You Will Receive
- Accurate Ono Pharmaceutical Financials: Access historical and projected data for precise valuation.
- Customizable Inputs: Adjust WACC, tax rates, revenue growth, and capital expenditures as needed.
- Instant Calculations: Intrinsic value and NPV are calculated automatically.
- Scenario Analysis: Evaluate various scenarios to assess the future performance of Ono Pharmaceutical (4528T).
- User-Friendly Design: Designed for industry professionals while remaining accessible to newcomers.
Key Features
- Real Ono Financials: Gain access to reliable pre-loaded historical data and forecasts for the future.
- Customizable Forecast Assumptions: Adjust easily editable cells highlighted in yellow, including WACC, growth rates, and margins.
- Dynamic Calculations: Enjoy real-time updates for DCF, Net Present Value (NPV), and cash flow analyses.
- Visual Dashboard: Intuitive charts and summaries designed to help you visualize your valuation outcomes.
- For Professionals and Beginners: An accessible and straightforward layout tailored for investors, CFOs, and consultants alike.
How It Works
- Download: Obtain the pre-prepared Excel file containing Ono Pharmaceutical Co., Ltd.'s (4528T) financial data.
- Customize: Modify forecasts such as revenue growth, EBITDA percentage, and WACC to suit your analysis.
- Update Automatically: Real-time updates for intrinsic value and NPV calculations ensure you have the latest information.
- Test Scenarios: Generate various projections and compare results with ease.
- Make Decisions: Utilize the valuation outcomes to inform your investment approach.
Why Opt for This Calculator?
- Precision: Utilizes authentic Ono Pharmaceutical financials for reliable data.
- Versatility: Tailored for users to experiment and adjust inputs at their convenience.
- Efficiency: Bypass the complexities of creating a DCF model from the ground up.
- Expert-Grade: Crafted with the accuracy and usability expected at the CFO level.
- Accessible: Intuitive design makes it simple for users with no advanced financial modeling skills.
Who Should Consider This Product?
- Investors: Accurately assess Ono Pharmaceutical Co., Ltd.'s (4528T) fair value prior to making investment choices.
- CFOs: Utilize a top-tier DCF model for financial reporting and analytical purposes.
- Consultants: Efficiently modify the template for valuation reports tailored to clients.
- Entrepreneurs: Acquire insights into financial modeling practices employed by leading pharmaceutical companies.
- Educators: Employ it as a teaching resource to illustrate various valuation techniques.
Contents of the Template
- Preloaded Ono Pharmaceutical Data: Historical and projected financial information, encompassing revenue, EBIT, and capital expenditures.
- DCF and WACC Models: Professional-grade worksheets designed for calculating intrinsic value and Weighted Average Cost of Capital.
- Editable Inputs: Yellow-highlighted fields for modifying revenue growth, tax rates, and discount rates.
- Financial Statements: Comprehensive annual and quarterly financial reports for in-depth analysis.
- Key Ratios: Profitability, leverage, and efficiency metrics to assess company performance.
- Dashboard and Charts: Visual representations of valuation results and underlying assumptions.
Disclaimer
All information, articles, and product details provided on this website are for general informational and educational purposes only. We do not claim any ownership over, nor do we intend to infringe upon, any trademarks, copyrights, logos, brand names, or other intellectual property mentioned or depicted on this site. Such intellectual property remains the property of its respective owners, and any references here are made solely for identification or informational purposes, without implying any affiliation, endorsement, or partnership.
We make no representations or warranties, express or implied, regarding the accuracy, completeness, or suitability of any content or products presented. Nothing on this website should be construed as legal, tax, investment, financial, medical, or other professional advice. In addition, no part of this site—including articles or product references—constitutes a solicitation, recommendation, endorsement, advertisement, or offer to buy or sell any securities, franchises, or other financial instruments, particularly in jurisdictions where such activity would be unlawful.
All content is of a general nature and may not address the specific circumstances of any individual or entity. It is not a substitute for professional advice or services. Any actions you take based on the information provided here are strictly at your own risk. You accept full responsibility for any decisions or outcomes arising from your use of this website and agree to release us from any liability in connection with your use of, or reliance upon, the content or products found herein.