
|
Daiichi Sankyo Company, Limited (4568.T) Avaliação DCF |
Totalmente Editável: Adapte-Se Às Suas Necessidades No Excel Ou Planilhas
Design Profissional: Modelos Confiáveis E Padrão Da Indústria
Pré-Construídos Para Uso Rápido E Eficiente
Compatível com MAC/PC, totalmente desbloqueado
Não É Necessária Experiência; Fácil De Seguir
Daiichi Sankyo Company, Limited (4568.T) Bundle
Aprimore suas opções de investimento com a Daiichi Sankyo Company, Limited (4568T) DCF Calculator! Utilize dados financeiros precisos, ajuste as expectativas e despesas de crescimento e observe como essas modificações influenciam o valor intrínseco da Daiichi Sankyo Company, Limited (4568T) em tempo real.
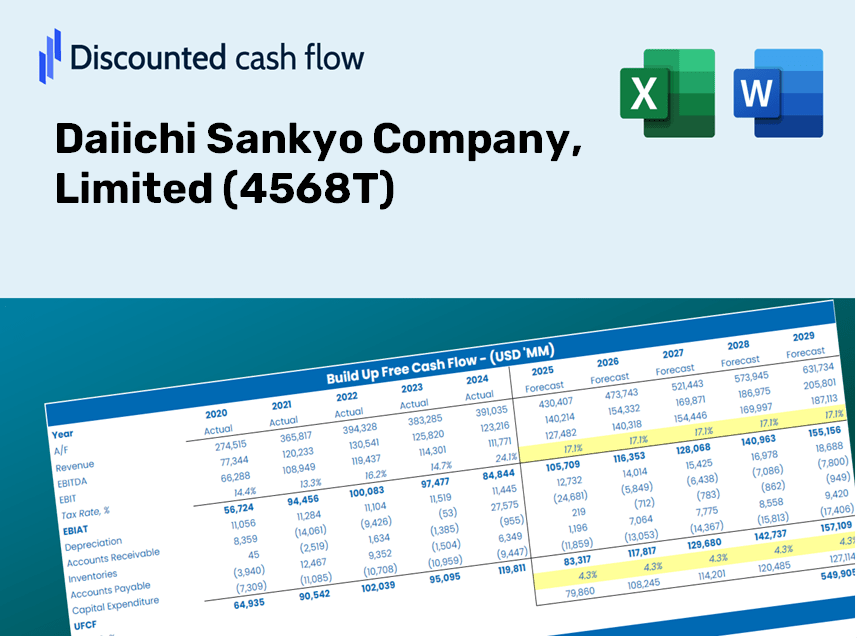
Discounted Cash Flow (DCF) - (USD MM)
| Year | AY1 2021 |
AY2 2022 |
AY3 2023 |
AY4 2024 |
AY5 2025 |
FY1 2026 |
FY2 2027 |
FY3 2028 |
FY4 2029 |
FY5 2030 |
|---|---|---|---|---|---|---|---|---|---|---|
| Revenue | 962,516.0 | 1,044,892.0 | 1,278,478.0 | 1,601,688.0 | 1,886,256.0 | 2,235,029.6 | 2,648,292.4 | 3,137,968.6 | 3,718,187.1 | 4,405,689.5 |
| Revenue Growth, % | 0 | 8.56 | 22.36 | 25.28 | 17.77 | 18.49 | 18.49 | 18.49 | 18.49 | 18.49 |
| EBITDA | 121,177.0 | 131,272.0 | 169,717.0 | 271,129.0 | 380,573.0 | 337,630.5 | 400,059.3 | 474,031.3 | 561,680.9 | 665,537.2 |
| EBITDA, % | 12.59 | 12.56 | 13.27 | 16.93 | 20.18 | 15.11 | 15.11 | 15.11 | 15.11 | 15.11 |
| Depreciation | 57,382.0 | 58,245.0 | 67,789.0 | 59,646.0 | 68,649.0 | 108,182.7 | 128,186.0 | 151,887.9 | 179,972.3 | 213,249.7 |
| Depreciation, % | 5.96 | 5.57 | 5.3 | 3.72 | 3.64 | 4.84 | 4.84 | 4.84 | 4.84 | 4.84 |
| EBIT | 63,795.0 | 73,027.0 | 101,928.0 | 211,483.0 | 311,924.0 | 229,447.8 | 271,873.3 | 322,143.4 | 381,708.6 | 452,287.5 |
| EBIT, % | 6.63 | 6.99 | 7.97 | 13.2 | 16.54 | 10.27 | 10.27 | 10.27 | 10.27 | 10.27 |
| Total Cash | 629,744.0 | 778,617.0 | 607,563.0 | 876,564.0 | 713,965.0 | 1,251,814.0 | 1,483,277.6 | 1,757,539.5 | 2,082,513.1 | 2,467,575.2 |
| Total Cash, percent | .0 | .0 | .0 | .0 | .0 | .0 | .0 | .0 | .0 | .0 |
| Account Receivables | 232,392.0 | 246,857.0 | 316,424.0 | 383,913.0 | 490,079.0 | 547,449.3 | 648,674.0 | 768,615.6 | 910,734.6 | 1,079,131.8 |
| Account Receivables, % | 24.14 | 23.63 | 24.75 | 23.97 | 25.98 | 24.49 | 24.49 | 24.49 | 24.49 | 24.49 |
| Inventories | 200,860.0 | 217,910.0 | 301,608.0 | 438,111.0 | 514,910.0 | 536,251.8 | 635,406.2 | 752,894.4 | 892,106.6 | 1,057,059.4 |
| Inventories, % | 20.87 | 20.85 | 23.59 | 27.35 | 27.3 | 23.99 | 23.99 | 23.99 | 23.99 | 23.99 |
| Accounts Payable | 68,691.0 | 68,536.0 | 80,385.0 | 557,131.0 | 92,757.0 | 266,794.7 | 316,125.7 | 374,578.2 | 443,838.7 | 525,905.6 |
| Accounts Payable, % | 7.14 | 6.56 | 6.29 | 34.78 | 4.92 | 11.94 | 11.94 | 11.94 | 11.94 | 11.94 |
| Capital Expenditure | -31,245.0 | -62,736.0 | -60,749.0 | -88,321.0 | -116,259.0 | -114,789.5 | -136,014.4 | -161,163.8 | -190,963.4 | -226,273.0 |
| Capital Expenditure, % | -3.25 | -6 | -4.75 | -5.51 | -6.16 | -5.14 | -5.14 | -5.14 | -5.14 | -5.14 |
| Tax Rate, % | 16.84 | 16.84 | 16.84 | 16.84 | 16.84 | 16.84 | 16.84 | 16.84 | 16.84 | 16.84 |
| EBITAT | 65,372.6 | 66,527.4 | 87,733.3 | 178,943.0 | 259,408.4 | 204,186.1 | 241,940.6 | 286,676.0 | 339,683.2 | 402,491.5 |
| Depreciation | ||||||||||
| Changes in Account Receivables | ||||||||||
| Changes in Inventories | ||||||||||
| Changes in Accounts Payable | ||||||||||
| Capital Expenditure | ||||||||||
| UFCF | -273,051.4 | 30,366.4 | -46,642.7 | 423,022.0 | -435,540.6 | 292,904.9 | 83,064.1 | 98,422.8 | 116,621.5 | 138,185.1 |
| WACC, % | 4.74 | 4.74 | 4.73 | 4.73 | 4.73 | 4.73 | 4.73 | 4.73 | 4.73 | 4.73 |
| PV UFCF | ||||||||||
| SUM PV UFCF | 647,643.3 | |||||||||
| Long Term Growth Rate, % | 4.00 | |||||||||
| Free cash flow (T + 1) | 143,712 | |||||||||
| Terminal Value | 19,588,945 | |||||||||
| Present Terminal Value | 15,544,617 | |||||||||
| Enterprise Value | 16,192,261 | |||||||||
| Net Debt | -211,565 | |||||||||
| Equity Value | 16,403,826 | |||||||||
| Diluted Shares Outstanding, MM | 1,897 | |||||||||
| Equity Value Per Share | 8,645.05 |
What You'll Receive
- Genuine DSNK Financial Data: Pre-populated with Daiichi Sankyo's historical and forecasted figures for accurate analysis.
- Completely Customizable Template: Easily adjust essential inputs such as revenue growth, WACC, and EBITDA percentage.
- Instant Calculations: Witness real-time updates of Daiichi Sankyo’s intrinsic value as you modify your inputs.
- Expert Valuation Tool: Crafted for investors, analysts, and consultants aiming for precise DCF outcomes.
- Intuitive Design: Clear layout and straightforward guidance suitable for users of all skill levels.
Key Features
- 🔍 Real-Life 4568T Financials: Pre-filled historical and projected data for Daiichi Sankyo Company, Limited.
- ✏️ Fully Customizable Inputs: Adjust all critical parameters (yellow cells) such as WACC, growth %, and tax rates.
- 📊 Professional DCF Valuation: Built-in formulas calculate Daiichi Sankyo’s intrinsic value using the Discounted Cash Flow method.
- ⚡ Instant Results: Visualize Daiichi Sankyo’s valuation instantly after making changes.
- Scenario Analysis: Test and compare outcomes for various financial assumptions side-by-side.
How It Works
- Step 1: Download the Excel file for Daiichi Sankyo Company, Limited (4568T).
- Step 2: Examine the pre-filled financial data and forecasts provided for Daiichi Sankyo.
- Step 3: Adjust key parameters such as revenue growth, WACC, and tax rates (highlighted cells).
- Step 4: Observe the DCF model refresh in real-time as you modify your assumptions.
- Step 5: Evaluate the results and leverage the findings to inform your investment decisions.
Why Choose the Daiichi Sankyo Calculator?
- Save Time: Skip the hassle of building a DCF model from the ground up – it’s ready for immediate use.
- Enhance Accuracy: Access dependable financial data and formulas to minimize errors in your valuation.
- Fully Customizable: Adjust the model to align with your own assumptions and forecasts.
- User-Friendly: Intuitive charts and outputs make it easy to comprehend results.
- Endorsed by Professionals: Crafted for experts who prioritize precision and functionality.
Who Can Benefit from This Product?
- Finance Students: Discover valuation techniques and apply them using actual data related to Daiichi Sankyo Company, Limited (4568T).
- Academics: Integrate professional models into your curriculum or research focused on Daiichi Sankyo Company, Limited (4568T).
- Investors: Challenge your assumptions and evaluate valuation outcomes for Daiichi Sankyo Company, Limited (4568T) stock.
- Analysts: Enhance your efficiency with a customizable DCF model designed for Daiichi Sankyo Company, Limited (4568T).
- Small Business Owners: Understand the analytical techniques used to assess large public companies like Daiichi Sankyo Company, Limited (4568T).
Contents of the Template
- Detailed DCF Model: Fully editable template featuring comprehensive valuation calculations.
- Current Financial Data: Preloaded historical and projected financials for Daiichi Sankyo Company, Limited (4568T) to facilitate in-depth analysis.
- Adjustable Inputs: Tailor WACC, growth rates, and tax assumptions to explore various scenarios.
- Complete Financial Statements: Annual and quarterly breakdowns provided for enhanced insights.
- Essential Ratios: Integrated analysis for profitability, efficiency, and leverage metrics.
- Interactive Dashboard: Visuals including charts and tables designed for clear, actionable insights.
Disclaimer
All information, articles, and product details provided on this website are for general informational and educational purposes only. We do not claim any ownership over, nor do we intend to infringe upon, any trademarks, copyrights, logos, brand names, or other intellectual property mentioned or depicted on this site. Such intellectual property remains the property of its respective owners, and any references here are made solely for identification or informational purposes, without implying any affiliation, endorsement, or partnership.
We make no representations or warranties, express or implied, regarding the accuracy, completeness, or suitability of any content or products presented. Nothing on this website should be construed as legal, tax, investment, financial, medical, or other professional advice. In addition, no part of this site—including articles or product references—constitutes a solicitation, recommendation, endorsement, advertisement, or offer to buy or sell any securities, franchises, or other financial instruments, particularly in jurisdictions where such activity would be unlawful.
All content is of a general nature and may not address the specific circumstances of any individual or entity. It is not a substitute for professional advice or services. Any actions you take based on the information provided here are strictly at your own risk. You accept full responsibility for any decisions or outcomes arising from your use of this website and agree to release us from any liability in connection with your use of, or reliance upon, the content or products found herein.