
|
ResortTrust, Inc. (4681.T) Avaliação DCF |
Totalmente Editável: Adapte-Se Às Suas Necessidades No Excel Ou Planilhas
Design Profissional: Modelos Confiáveis E Padrão Da Indústria
Pré-Construídos Para Uso Rápido E Eficiente
Compatível com MAC/PC, totalmente desbloqueado
Não É Necessária Experiência; Fácil De Seguir
Resorttrust, Inc. (4681.T) Bundle
Simplifique sua análise e melhore a precisão com a nossa calculadora DCF (4681T)! Utilizando dados Real ResortTrust, Inc. e suposições personalizáveis, essa ferramenta o capacita a prever, analisar e Value ResortTrust, Inc. como um investidor experiente.
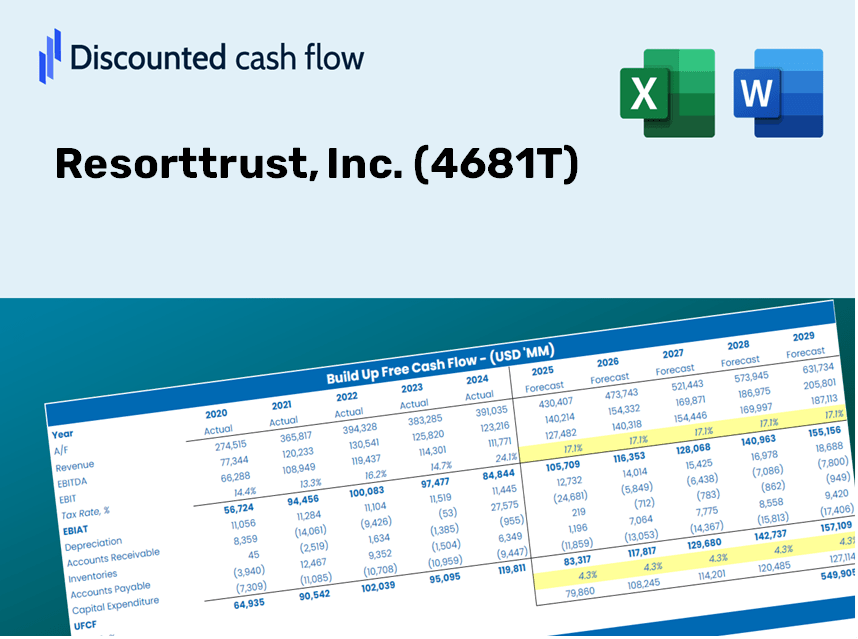
Discounted Cash Flow (DCF) - (USD MM)
| Year | AY1 2020 |
AY2 2021 |
AY3 2022 |
AY4 2023 |
AY5 2024 |
FY1 2025 |
FY2 2026 |
FY3 2027 |
FY4 2028 |
FY5 2029 |
|---|---|---|---|---|---|---|---|---|---|---|
| Revenue | 167,538.0 | 157,782.0 | 169,830.0 | 201,803.0 | 249,333.0 | 276,879.2 | 307,468.7 | 341,437.7 | 379,159.6 | 421,049.1 |
| Revenue Growth, % | 0 | -5.82 | 7.64 | 18.83 | 23.55 | 11.05 | 11.05 | 11.05 | 11.05 | 11.05 |
| EBITDA | 5,415.0 | 22,756.0 | 32,529.0 | 32,608.0 | 38,902.0 | 37,970.7 | 42,165.7 | 46,824.2 | 51,997.3 | 57,742.0 |
| EBITDA, % | 3.23 | 14.42 | 19.15 | 16.16 | 15.6 | 13.71 | 13.71 | 13.71 | 13.71 | 13.71 |
| Depreciation | 11,925.0 | 11,148.0 | 9,686.0 | 9,423.0 | 10,138.0 | 15,849.7 | 17,600.8 | 19,545.3 | 21,704.6 | 24,102.6 |
| Depreciation, % | 7.12 | 7.07 | 5.7 | 4.67 | 4.07 | 5.72 | 5.72 | 5.72 | 5.72 | 5.72 |
| EBIT | -6,510.0 | 11,608.0 | 22,843.0 | 23,185.0 | 28,764.0 | 22,121.1 | 24,565.0 | 27,278.9 | 30,292.7 | 33,639.4 |
| EBIT, % | -3.89 | 7.36 | 13.45 | 11.49 | 11.54 | 7.99 | 7.99 | 7.99 | 7.99 | 7.99 |
| Total Cash | 59,062.0 | 32,395.0 | 39,284.0 | 40,510.0 | 34,245.0 | 62,422.1 | 69,318.5 | 76,976.8 | 85,481.1 | 94,925.0 |
| Total Cash, percent | .0 | .0 | .0 | .0 | .0 | .0 | .0 | .0 | .0 | .0 |
| Account Receivables | 67,300.0 | 86,105.0 | 108,688.0 | 114,696.0 | 119,653.0 | 145,951.4 | 162,076.0 | 179,982.1 | 199,866.5 | 221,947.7 |
| Account Receivables, % | 40.17 | 54.57 | 64 | 56.84 | 47.99 | 52.71 | 52.71 | 52.71 | 52.71 | 52.71 |
| Inventories | 21,526.0 | 14,797.0 | 33,576.0 | 38,442.0 | 33,031.0 | 41,140.9 | 45,686.1 | 50,733.5 | 56,338.5 | 62,562.8 |
| Inventories, % | 12.85 | 9.38 | 19.77 | 19.05 | 13.25 | 14.86 | 14.86 | 14.86 | 14.86 | 14.86 |
| Accounts Payable | 1,335.0 | 1,354.0 | 1,738.0 | 1,787.0 | 1,869.0 | 2,388.6 | 2,652.5 | 2,945.6 | 3,271.0 | 3,632.4 |
| Accounts Payable, % | 0.79683 | 0.85815 | 1.02 | 0.88552 | 0.7496 | 0.86269 | 0.86269 | 0.86269 | 0.86269 | 0.86269 |
| Capital Expenditure | -15,240.0 | -6,322.0 | -10,303.0 | -18,833.0 | -19,492.0 | -20,112.5 | -22,334.5 | -24,802.0 | -27,542.1 | -30,584.9 |
| Capital Expenditure, % | -9.1 | -4.01 | -6.07 | -9.33 | -7.82 | -7.26 | -7.26 | -7.26 | -7.26 | -7.26 |
| Tax Rate, % | 29.11 | 29.11 | 29.11 | 29.11 | 29.11 | 29.11 | 29.11 | 29.11 | 29.11 | 29.11 |
| EBITAT | -9,562.3 | 6,218.6 | 17,112.8 | 16,110.9 | 20,390.2 | 16,319.3 | 18,122.2 | 20,124.3 | 22,347.7 | 24,816.6 |
| Depreciation | ||||||||||
| Changes in Account Receivables | ||||||||||
| Changes in Inventories | ||||||||||
| Changes in Accounts Payable | ||||||||||
| Capital Expenditure | ||||||||||
| UFCF | -100,368.3 | -1,012.4 | -24,482.2 | -4,124.1 | 11,572.2 | -21,832.2 | -7,017.5 | -7,792.8 | -8,653.7 | -9,609.8 |
| WACC, % | 4.95 | 4.81 | 4.88 | 4.86 | 4.87 | 4.87 | 4.87 | 4.87 | 4.87 | 4.87 |
| PV UFCF | ||||||||||
| SUM PV UFCF | -48,682.9 | |||||||||
| Long Term Growth Rate, % | 1.00 | |||||||||
| Free cash flow (T + 1) | -9,706 | |||||||||
| Terminal Value | -250,560 | |||||||||
| Present Terminal Value | -197,505 | |||||||||
| Enterprise Value | -246,188 | |||||||||
| Net Debt | 5,152 | |||||||||
| Equity Value | -251,340 | |||||||||
| Diluted Shares Outstanding, MM | 212 | |||||||||
| Equity Value Per Share | -1,188.02 |
What You Will Receive
- Pre-Configured Financial Model: Resorttrust, Inc.’s actual data provides an accurate DCF valuation.
- Complete Forecasting Flexibility: Modify revenue growth rates, profit margins, WACC, and other essential parameters.
- Real-Time Calculations: Instant updates ensure you see the impact of changes immediately.
- Professional-Grade Template: An expertly crafted Excel file suitable for high-level valuation.
- Customizable and Reusable: Designed for adaptability, allowing for repeated use in comprehensive forecasting.
Key Features
- Accurate Financial Data: Gain access to reliable historical data and future forecasts for Resorttrust, Inc. (4681T).
- Adjustable Forecast Parameters: Modify highlighted fields such as WACC, growth rates, and profit margins to suit your analysis.
- Real-Time Calculations: Enjoy automatic updates for DCF, Net Present Value (NPV), and cash flow evaluations.
- User-Friendly Dashboard: Intuitive charts and summaries to effectively visualize your valuation outcomes.
- Designed for All Levels: An easy-to-navigate interface tailored for investors, CFOs, and financial consultants.
How It Functions
- Step 1: Download the Excel spreadsheet.
- Step 2: Examine the pre-filled Resorttrust, Inc. (4681T) data (historical and projected).
- Step 3: Modify key assumptions (yellow cells) according to your insights.
- Step 4: Observe automatic recalculations for the intrinsic value of Resorttrust, Inc. (4681T).
- Step 5: Utilize the results for making investment choices or generating reports.
Why Opt for Resorttrust, Inc. ([4681T])?
- Precise Data: Utilizes authentic Resorttrust financials to ensure precise information.
- Versatility: Created for users to experiment and adjust inputs effortlessly.
- Efficiency: Eliminate the need to build a financial model from scratch.
- CFO-Level Quality: Crafted with the accuracy and usability required by financial leaders.
- Intuitive Interface: Simple to navigate, even for those lacking extensive financial modeling skills.
Who Can Benefit from This Service?
- Real Estate Investors: Develop comprehensive and accurate valuation models for property portfolios.
- Hospitality Management Teams: Evaluate valuation scenarios to inform strategic decision-making.
- Consultants and Advisors: Deliver precise valuation insights for Resorttrust, Inc. (4681T) to your clients.
- Students and Educators: Utilize real-time data to enhance learning and practice in financial modeling.
- Travel Enthusiasts: Gain insights into how hospitality companies like Resorttrust, Inc. (4681T) are valued in the market.
Contents of the Template
- Comprehensive DCF Model: Editable template featuring detailed valuation calculations tailored for Resorttrust, Inc. (4681T).
- Real-World Data: Preloaded historical and projected financials specific to Resorttrust, Inc. (4681T) for in-depth analysis.
- Customizable Parameters: Modify WACC, growth rates, and tax assumptions to explore various scenarios.
- Financial Statements: Complete annual and quarterly breakdowns offering deeper insights into financial performance.
- Key Ratios: Built-in analysis covering profitability, efficiency, and leverage metrics.
- Dashboard with Visual Outputs: Charts and tables designed for clear and actionable financial results.
Disclaimer
All information, articles, and product details provided on this website are for general informational and educational purposes only. We do not claim any ownership over, nor do we intend to infringe upon, any trademarks, copyrights, logos, brand names, or other intellectual property mentioned or depicted on this site. Such intellectual property remains the property of its respective owners, and any references here are made solely for identification or informational purposes, without implying any affiliation, endorsement, or partnership.
We make no representations or warranties, express or implied, regarding the accuracy, completeness, or suitability of any content or products presented. Nothing on this website should be construed as legal, tax, investment, financial, medical, or other professional advice. In addition, no part of this site—including articles or product references—constitutes a solicitation, recommendation, endorsement, advertisement, or offer to buy or sell any securities, franchises, or other financial instruments, particularly in jurisdictions where such activity would be unlawful.
All content is of a general nature and may not address the specific circumstances of any individual or entity. It is not a substitute for professional advice or services. Any actions you take based on the information provided here are strictly at your own risk. You accept full responsibility for any decisions or outcomes arising from your use of this website and agree to release us from any liability in connection with your use of, or reliance upon, the content or products found herein.