
|
Ly Corporation (4689.T) Avaliação DCF |
Totalmente Editável: Adapte-Se Às Suas Necessidades No Excel Ou Planilhas
Design Profissional: Modelos Confiáveis E Padrão Da Indústria
Pré-Construídos Para Uso Rápido E Eficiente
Compatível com MAC/PC, totalmente desbloqueado
Não É Necessária Experiência; Fácil De Seguir
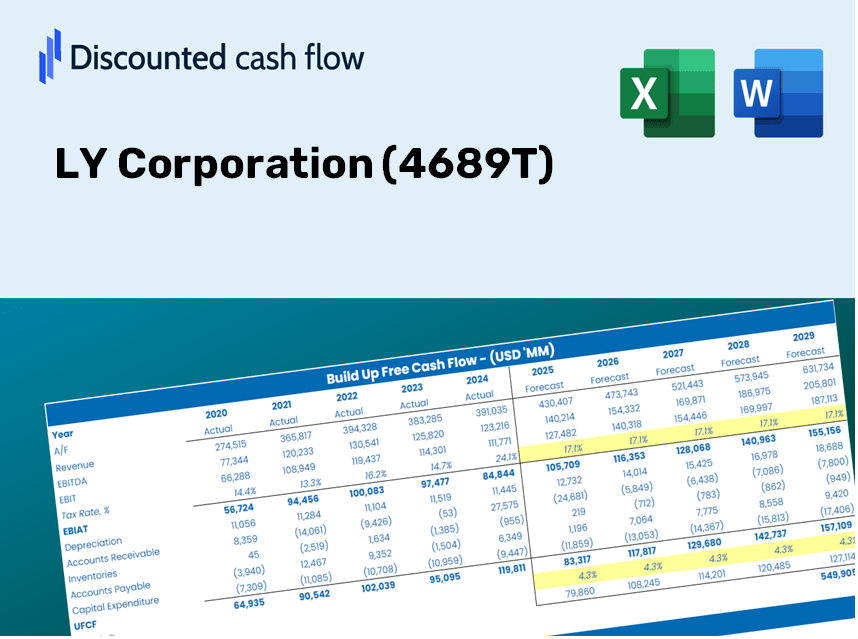
LY Corporation (4689.T) Bundle
Procurando avaliar o valor intrínseco da Ly Corporation? Nossa calculadora DCF (4689T) integra dados do mundo real com recursos abrangentes de personalização, permitindo refinar suas previsões e aprimorar suas estratégias de investimento.
Discounted Cash Flow (DCF) - (USD MM)
| Year | AY1 2021 |
AY2 2022 |
AY3 2023 |
AY4 2024 |
AY5 2025 |
FY1 2026 |
FY2 2027 |
FY3 2028 |
FY4 2029 |
FY5 2030 |
|---|---|---|---|---|---|---|---|---|---|---|
| Revenue | 1,205,846.0 | 1,567,421.0 | 1,672,377.0 | 1,814,663.0 | 1,917,478.0 | 2,161,261.7 | 2,436,039.5 | 2,745,751.8 | 3,094,840.3 | 3,488,311.1 |
| Revenue Growth, % | 0 | 29.99 | 6.7 | 8.51 | 5.67 | 12.71 | 12.71 | 12.71 | 12.71 | 12.71 |
| EBITDA | 267,453.0 | 337,771.0 | 306,808.0 | 361,299.0 | 444,435.0 | 454,569.0 | 512,361.8 | 577,502.3 | 650,924.6 | 733,681.7 |
| EBITDA, % | 22.18 | 21.55 | 18.35 | 19.91 | 23.18 | 21.03 | 21.03 | 21.03 | 21.03 | 21.03 |
| Depreciation | 102,080.0 | 135,744.0 | 148,776.0 | 162,917.0 | 159,874.0 | 187,326.8 | 211,143.1 | 237,987.4 | 268,244.5 | 302,348.5 |
| Depreciation, % | 8.47 | 8.66 | 8.9 | 8.98 | 8.34 | 8.67 | 8.67 | 8.67 | 8.67 | 8.67 |
| EBIT | 165,373.0 | 202,027.0 | 158,032.0 | 198,382.0 | 284,561.0 | 267,242.2 | 301,218.7 | 339,514.9 | 382,680.1 | 431,333.1 |
| EBIT, % | 13.71 | 12.89 | 9.45 | 10.93 | 14.84 | 12.37 | 12.37 | 12.37 | 12.37 | 12.37 |
| Total Cash | 1,065,726.0 | 1,127,523.0 | 1,651,851.0 | 1,420,430.0 | 1,043,944.0 | 1,693,591.6 | 1,908,910.9 | 2,151,605.4 | 2,425,155.5 | 2,733,484.1 |
| Total Cash, percent | .0 | .0 | .0 | .0 | .0 | .0 | .0 | .0 | .0 | .0 |
| Account Receivables | 1,200,197.0 | 844,146.0 | 1,125,168.0 | 2,307,129.0 | 736,275.0 | 1,552,066.5 | 1,749,392.6 | 1,971,806.3 | 2,222,497.2 | 2,505,060.3 |
| Account Receivables, % | 99.53 | 53.86 | 67.28 | 127.14 | 38.4 | 71.81 | 71.81 | 71.81 | 71.81 | 71.81 |
| Inventories | 24,668.0 | 26,671.0 | 31,690.0 | 35,028.0 | 32,436.0 | 40,044.1 | 45,135.3 | 50,873.7 | 57,341.6 | 64,631.9 |
| Inventories, % | 2.05 | 1.7 | 1.89 | 1.93 | 1.69 | 1.85 | 1.85 | 1.85 | 1.85 | 1.85 |
| Accounts Payable | 616,681.0 | 524,989.0 | 1,351,794.0 | 1,551,611.0 | 1,712,145.0 | 1,470,786.3 | 1,657,778.6 | 1,868,544.8 | 2,106,107.2 | 2,373,872.7 |
| Accounts Payable, % | 51.14 | 33.49 | 80.83 | 85.5 | 89.29 | 68.05 | 68.05 | 68.05 | 68.05 | 68.05 |
| Capital Expenditure | -70,741.0 | -272,633.0 | -148,986.0 | -71,009.0 | -99,740.0 | -178,449.2 | -201,136.8 | -226,708.8 | -255,532.1 | -288,019.8 |
| Capital Expenditure, % | -5.87 | -17.39 | -8.91 | -3.91 | -5.2 | -8.26 | -8.26 | -8.26 | -8.26 | -8.26 |
| Tax Rate, % | 46.07 | 46.07 | 46.07 | 46.07 | 46.07 | 46.07 | 46.07 | 46.07 | 46.07 | 46.07 |
| EBITAT | 81,338.5 | 98,522.3 | 120,172.6 | 123,645.6 | 153,466.1 | 155,135.6 | 174,859.1 | 197,090.3 | 222,147.9 | 250,391.3 |
| Depreciation | ||||||||||
| Changes in Account Receivables | ||||||||||
| Changes in Inventories | ||||||||||
| Changes in Accounts Payable | ||||||||||
| Capital Expenditure | ||||||||||
| UFCF | -495,506.5 | 223,989.3 | 660,726.6 | -769,928.4 | 1,947,580.1 | -900,745.1 | 169,440.6 | 190,982.9 | 215,264.0 | 242,632.2 |
| WACC, % | 4.05 | 4.05 | 4.38 | 4.21 | 4.11 | 4.16 | 4.16 | 4.16 | 4.16 | 4.16 |
| PV UFCF | ||||||||||
| SUM PV UFCF | -158,835.0 | |||||||||
| Long Term Growth Rate, % | 1.00 | |||||||||
| Free cash flow (T + 1) | 245,058 | |||||||||
| Terminal Value | 7,751,642 | |||||||||
| Present Terminal Value | 6,322,082 | |||||||||
| Enterprise Value | 6,163,248 | |||||||||
| Net Debt | 650,454 | |||||||||
| Equity Value | 5,512,794 | |||||||||
| Diluted Shares Outstanding, MM | 7,337 | |||||||||
| Equity Value Per Share | 751.36 |
What You Will Receive
- Customizable Excel Template: A fully adjustable Excel-based DCF Calculator featuring pre-filled financial data for LY Corporation (4689T).
- Authentic Data: Access to historical figures and projections (highlighted in the yellow cells).
- Flexible Forecasting: Modify forecast parameters such as revenue growth, EBITDA percentage, and WACC.
- Instant Calculations: Quickly observe how your inputs affect LY Corporation’s valuation.
- Professional Grade Tool: Designed for investors, CFOs, consultants, and financial analysts.
- User-Centric Layout: Organized for ease of understanding and usability, complete with step-by-step guidance.
Core Attributes
- Customizable Forecast Variables: Adjust essential factors such as revenue growth, EBITDA %, and capital expenditures.
- Instant DCF Valuation: Automatically computes intrinsic value, NPV, and other metrics without delay.
- High Precision Results: Leverages LY Corporation's (4689T) actual financial data for credible valuation insights.
- Simplified Scenario Analysis: Effortlessly evaluate various assumptions and assess results side by side.
- Efficiency Booster: Remove the hassle of creating intricate valuation models from the ground up.
How It Functions
- Download: Obtain the pre-configured Excel file containing LY Corporation's (4689T) financial data.
- Tailor: Modify forecasts such as revenue growth, EBITDA %, and WACC to suit your analysis.
- Real-Time Updates: Watch as intrinsic value and NPV calculations refresh automatically.
- Explore Scenarios: Generate various projections and instantly compare results.
- Make Informed Choices: Leverage the valuation findings to shape your investment strategy.
Why Choose the LY Corporation (4689T) Calculator?
- Time-Saving: Skip the hassle of building a DCF model from the ground up – it's ready for immediate use.
- Enhanced Accuracy: Dependable financial data and formulas minimize valuation errors.
- Completely Customizable: Adjust the model to align with your specific assumptions and forecasts.
- User-Friendly: Intuitive charts and outputs simplify result interpretation.
- Endorsed by Professionals: Crafted for industry experts who prioritize precision and functionality.
Who Can Benefit from LY Corporation's Services?
- Professional Investors: Develop comprehensive and dependable valuation models for portfolio assessment.
- Corporate Finance Teams: Evaluate valuation scenarios to inform strategic decisions within the organization.
- Consultants and Advisors: Deliver precise valuation analysis to clients investing in LY Corporation (4689T).
- Students and Educators: Leverage real-world data to refine skills and teach financial modeling techniques.
- Tech Enthusiasts: Gain insights into how technology firms like LY Corporation (4689T) are assessed in the marketplace.
Contents of the Template
- Historical Data: Contains LY Corporation's past financial performance and foundational forecasts.
- DCF and Levered DCF Models: Comprehensive templates designed to assess LY Corporation's intrinsic value.
- WACC Sheet: Pre-configured calculations for the Weighted Average Cost of Capital.
- Editable Inputs: Update essential drivers such as growth rates, EBITDA percentages, and CAPEX projections.
- Quarterly and Annual Statements: A thorough analysis of LY Corporation's financial statements.
- Interactive Dashboard: A dynamic visualization of valuation outcomes and forecasts.
Disclaimer
All information, articles, and product details provided on this website are for general informational and educational purposes only. We do not claim any ownership over, nor do we intend to infringe upon, any trademarks, copyrights, logos, brand names, or other intellectual property mentioned or depicted on this site. Such intellectual property remains the property of its respective owners, and any references here are made solely for identification or informational purposes, without implying any affiliation, endorsement, or partnership.
We make no representations or warranties, express or implied, regarding the accuracy, completeness, or suitability of any content or products presented. Nothing on this website should be construed as legal, tax, investment, financial, medical, or other professional advice. In addition, no part of this site—including articles or product references—constitutes a solicitation, recommendation, endorsement, advertisement, or offer to buy or sell any securities, franchises, or other financial instruments, particularly in jurisdictions where such activity would be unlawful.
All content is of a general nature and may not address the specific circumstances of any individual or entity. It is not a substitute for professional advice or services. Any actions you take based on the information provided here are strictly at your own risk. You accept full responsibility for any decisions or outcomes arising from your use of this website and agree to release us from any liability in connection with your use of, or reliance upon, the content or products found herein.