
|
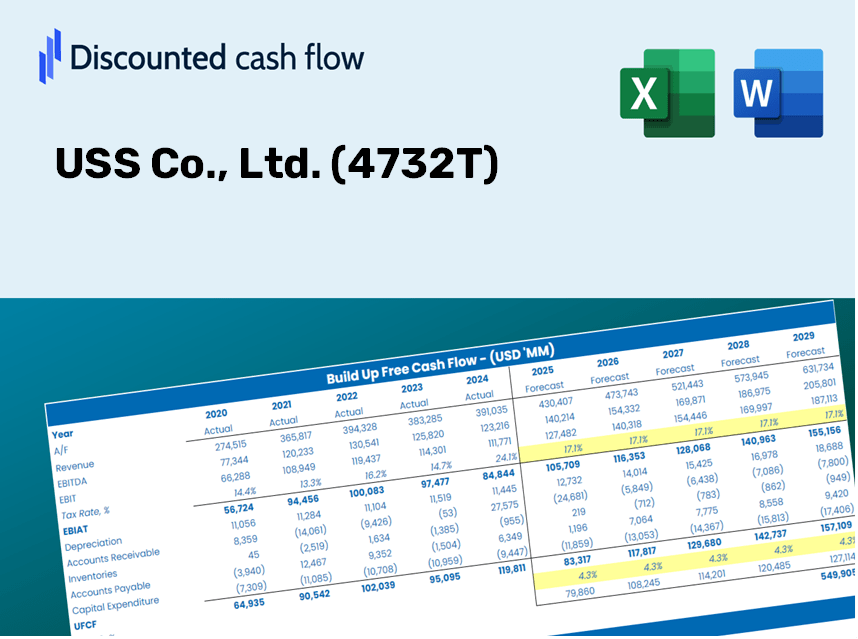
USS Co., Ltd. (4732.T) Avaliação DCF |
Totalmente Editável: Adapte-Se Às Suas Necessidades No Excel Ou Planilhas
Design Profissional: Modelos Confiáveis E Padrão Da Indústria
Pré-Construídos Para Uso Rápido E Eficiente
Compatível com MAC/PC, totalmente desbloqueado
Não É Necessária Experiência; Fácil De Seguir
USS Co., Ltd. (4732.T) Bundle
Explore o futuro financeiro da USS Co., Ltd. (4732T) com nossa calculadora DCF amigável! Digite suas projeções de crescimento, margens e despesas para calcular o valor intrínseco da USS Co., Ltd. (4732T) e aprimore sua estratégia de investimento.
Discounted Cash Flow (DCF) - (USD MM)
| Year | AY1 2021 |
AY2 2022 |
AY3 2023 |
AY4 2024 |
AY5 2025 |
FY1 2026 |
FY2 2027 |
FY3 2028 |
FY4 2029 |
FY5 2030 |
|---|---|---|---|---|---|---|---|---|---|---|
| Revenue | 74,874.0 | 81,482.0 | 88,778.0 | 97,606.0 | 104,021.0 | 112,939.7 | 122,623.1 | 133,136.8 | 144,551.9 | 156,945.7 |
| Revenue Growth, % | 0 | 8.83 | 8.95 | 9.94 | 6.57 | 8.57 | 8.57 | 8.57 | 8.57 | 8.57 |
| EBITDA | 22,346.0 | 49,515.0 | 49,805.0 | 53,913.0 | 60,253.0 | 58,699.9 | 63,732.8 | 69,197.2 | 75,130.2 | 81,571.8 |
| EBITDA, % | 29.84 | 60.77 | 56.1 | 55.24 | 57.92 | 51.97 | 51.97 | 51.97 | 51.97 | 51.97 |
| Depreciation | 7,113.0 | 5,629.0 | 5,293.0 | 5,245.0 | 5,287.0 | 7,414.8 | 8,050.6 | 8,740.8 | 9,490.3 | 10,304.0 |
| Depreciation, % | 9.5 | 6.91 | 5.96 | 5.37 | 5.08 | 6.57 | 6.57 | 6.57 | 6.57 | 6.57 |
| EBIT | 15,233.0 | 43,886.0 | 44,512.0 | 48,668.0 | 54,966.0 | 51,285.0 | 55,682.2 | 60,456.4 | 65,639.9 | 71,267.8 |
| EBIT, % | 20.34 | 53.86 | 50.14 | 49.86 | 52.84 | 45.41 | 45.41 | 45.41 | 45.41 | 45.41 |
| Total Cash | 70,770.0 | 82,380.0 | 95,692.0 | 112,009.0 | 116,219.0 | 111,701.6 | 121,278.9 | 131,677.3 | 142,967.3 | 155,225.2 |
| Total Cash, percent | .0 | .0 | .0 | .0 | .0 | .0 | .0 | .0 | .0 | .0 |
| Account Receivables | 8,788.0 | 16,979.0 | 16,261.0 | 27,105.0 | 24,777.0 | 23,148.2 | 25,132.9 | 27,287.8 | 29,627.4 | 32,167.7 |
| Account Receivables, % | 11.74 | 20.84 | 18.32 | 27.77 | 23.82 | 20.5 | 20.5 | 20.5 | 20.5 | 20.5 |
| Inventories | 1,028.0 | 1,206.0 | 1,843.0 | 1,651.0 | 1,656.0 | 1,855.0 | 2,014.1 | 2,186.8 | 2,374.3 | 2,577.8 |
| Inventories, % | 1.37 | 1.48 | 2.08 | 1.69 | 1.59 | 1.64 | 1.64 | 1.64 | 1.64 | 1.64 |
| Accounts Payable | 12,495.0 | 21,911.0 | 23,450.0 | 44,740.0 | 30,909.0 | 32,875.5 | 35,694.2 | 38,754.6 | 42,077.4 | 45,685.1 |
| Accounts Payable, % | 16.69 | 26.89 | 26.41 | 45.84 | 29.71 | 29.11 | 29.11 | 29.11 | 29.11 | 29.11 |
| Capital Expenditure | -8,985.0 | -2,036.0 | -4,566.0 | -2,665.0 | -2,771.0 | -5,655.2 | -6,140.1 | -6,666.5 | -7,238.1 | -7,858.7 |
| Capital Expenditure, % | -12 | -2.5 | -5.14 | -2.73 | -2.66 | -5.01 | -5.01 | -5.01 | -5.01 | -5.01 |
| Tax Rate, % | 31.51 | 31.51 | 31.51 | 31.51 | 31.51 | 31.51 | 31.51 | 31.51 | 31.51 | 31.51 |
| EBITAT | 4,025.4 | 29,753.1 | 30,015.4 | 32,912.8 | 37,643.5 | 30,541.9 | 33,160.6 | 36,003.8 | 39,090.7 | 42,442.4 |
| Depreciation | ||||||||||
| Changes in Account Receivables | ||||||||||
| Changes in Inventories | ||||||||||
| Changes in Accounts Payable | ||||||||||
| Capital Expenditure | ||||||||||
| UFCF | 4,832.4 | 34,393.1 | 32,362.4 | 46,130.8 | 28,651.5 | 35,697.9 | 35,746.1 | 38,811.0 | 42,138.6 | 45,751.6 |
| WACC, % | 5.52 | 5.52 | 5.52 | 5.52 | 5.52 | 5.52 | 5.52 | 5.52 | 5.52 | 5.52 |
| PV UFCF | ||||||||||
| SUM PV UFCF | 167,916.2 | |||||||||
| Long Term Growth Rate, % | 2.00 | |||||||||
| Free cash flow (T + 1) | 46,667 | |||||||||
| Terminal Value | 1,324,701 | |||||||||
| Present Terminal Value | 1,012,479 | |||||||||
| Enterprise Value | 1,180,396 | |||||||||
| Net Debt | -110,974 | |||||||||
| Equity Value | 1,291,370 | |||||||||
| Diluted Shares Outstanding, MM | 479 | |||||||||
| Equity Value Per Share | 2,694.14 |
What You Can Expect
- Actual USS Financials: Provides historical and projected data for precise valuation.
- Customizable Inputs: Adjust WACC, tax rates, revenue growth, and capital expenditures as needed.
- Instant Calculations: Intrinsic value and NPV are computed in real-time.
- Scenario Evaluation: Analyze various scenarios to assess the future performance of USS Co., Ltd. (4732T).
- User-Friendly Design: Crafted for professionals while remaining approachable for newcomers.
Key Features
- Pre-Loaded Data: USS Co., Ltd.'s historical financial records and pre-filled projections.
- Fully Customizable Inputs: Modify WACC, tax rates, revenue growth, and EBITDA margins as needed.
- Instant Results: View USS Co., Ltd.'s intrinsic value update in real time.
- Clear Visual Outputs: Dashboard charts illustrate valuation outcomes and essential metrics.
- Designed for Precision: A professional-grade tool tailored for analysts, investors, and financial professionals.
How It Works
- 1. Access the Template: Download and open the Excel file containing USS Co., Ltd.'s (4732T) preloaded data.
- 2. Modify Assumptions: Adjust key parameters such as growth rates, WACC, and capital expenditures.
- 3. View Immediate Results: The DCF model automatically calculates intrinsic value and NPV.
- 4. Explore Scenarios: Evaluate multiple forecasts to assess various valuation outcomes.
- 5. Present with Assurance: Deliver professional valuation insights to bolster your strategic decisions.
Why Choose USS Co., Ltd. Calculator?
- Precision: Utilizes authentic USS Co., Ltd. (4732T) financial data for reliable calculations.
- Versatility: Allows users to easily adjust and experiment with various inputs.
- Efficiency: Eliminate the complexity of creating a DCF model from the ground up.
- Quality: Crafted with the expertise and attention to detail expected at the executive level.
- Accessibility: Simple interface suitable for users of all financial backgrounds.
Who Can Benefit from USS Co., Ltd. (4732T)?
- Finance Students: Acquire valuation expertise and practice with actual data sets.
- Researchers: Integrate advanced financial models into your academic projects.
- Investors: Evaluate your assumptions and analyze valuation results for USS Co., Ltd. (4732T).
- Financial Analysts: Enhance your efficiency with a customizable DCF model tailored for your needs.
- Small Business Owners: Understand the analytical frameworks used for evaluating major public companies like USS Co., Ltd. (4732T).
Contents of the Template
- Preloaded USS Co., Ltd. Data: Historical and projected financial metrics, including revenue, EBIT, and capital expenditures.
- DCF and WACC Models: Professional-grade spreadsheets for determining intrinsic value and Weighted Average Cost of Capital.
- Editable Inputs: Yellow-highlighted cells for modifying revenue growth, tax rates, and discount rates.
- Financial Statements: Detailed annual and quarterly financial reports for thorough analysis.
- Key Ratios: Profitability, leverage, and efficiency ratios to assess performance.
- Dashboard and Charts: Visual summaries of valuation results and underlying assumptions.
Disclaimer
All information, articles, and product details provided on this website are for general informational and educational purposes only. We do not claim any ownership over, nor do we intend to infringe upon, any trademarks, copyrights, logos, brand names, or other intellectual property mentioned or depicted on this site. Such intellectual property remains the property of its respective owners, and any references here are made solely for identification or informational purposes, without implying any affiliation, endorsement, or partnership.
We make no representations or warranties, express or implied, regarding the accuracy, completeness, or suitability of any content or products presented. Nothing on this website should be construed as legal, tax, investment, financial, medical, or other professional advice. In addition, no part of this site—including articles or product references—constitutes a solicitation, recommendation, endorsement, advertisement, or offer to buy or sell any securities, franchises, or other financial instruments, particularly in jurisdictions where such activity would be unlawful.
All content is of a general nature and may not address the specific circumstances of any individual or entity. It is not a substitute for professional advice or services. Any actions you take based on the information provided here are strictly at your own risk. You accept full responsibility for any decisions or outcomes arising from your use of this website and agree to release us from any liability in connection with your use of, or reliance upon, the content or products found herein.