
|
Digital Garage, Inc. (4819.T) Avaliação DCF |
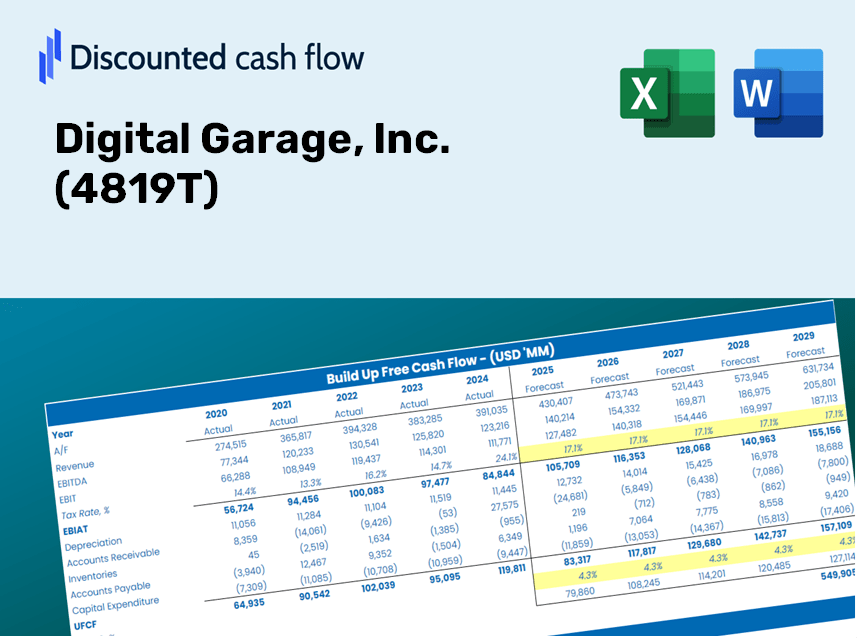
Totalmente Editável: Adapte-Se Às Suas Necessidades No Excel Ou Planilhas
Design Profissional: Modelos Confiáveis E Padrão Da Indústria
Pré-Construídos Para Uso Rápido E Eficiente
Compatível com MAC/PC, totalmente desbloqueado
Não É Necessária Experiência; Fácil De Seguir
Digital Garage, Inc. (4819.T) Bundle
Avalie as perspectivas financeiras da Digital Garage, Inc. como um especialista! Esta calculadora (4819T) DCF fornece dados financeiros pré-preenchidos e flexibilidade total para modificar o crescimento da receita, WACC, margens e outras suposições cruciais para se alinhar às suas previsões.
Discounted Cash Flow (DCF) - (USD MM)
| Year | AY1 2020 |
AY2 2021 |
AY3 2022 |
AY4 2023 |
AY5 2024 |
FY1 2025 |
FY2 2026 |
FY3 2027 |
FY4 2028 |
FY5 2029 |
|---|---|---|---|---|---|---|---|---|---|---|
| Revenue | 40,479.0 | 72,955.0 | 30,070.0 | 31,378.0 | 32,201.0 | 34,488.8 | 36,939.2 | 39,563.6 | 42,374.5 | 45,385.2 |
| Revenue Growth, % | 0 | 80.23 | -58.78 | 4.35 | 2.62 | 7.1 | 7.1 | 7.1 | 7.1 | 7.1 |
| EBITDA | 14,793.0 | 31,504.0 | -5,314.0 | 10,303.0 | -5,690.0 | 5,326.5 | 5,704.9 | 6,110.2 | 6,544.4 | 7,009.3 |
| EBITDA, % | 36.54 | 43.18 | -17.67 | 32.84 | -17.67 | 15.44 | 15.44 | 15.44 | 15.44 | 15.44 |
| Depreciation | 3,637.0 | 3,620.0 | 3,632.0 | 3,760.0 | 4,155.0 | 3,511.8 | 3,761.3 | 4,028.5 | 4,314.7 | 4,621.3 |
| Depreciation, % | 8.98 | 4.96 | 12.08 | 11.98 | 12.9 | 10.18 | 10.18 | 10.18 | 10.18 | 10.18 |
| EBIT | 11,156.0 | 27,884.0 | -8,946.0 | 6,543.0 | -9,845.0 | 1,814.7 | 1,943.7 | 2,081.7 | 2,229.6 | 2,388.1 |
| EBIT, % | 27.56 | 38.22 | -29.75 | 20.85 | -30.57 | 5.26 | 5.26 | 5.26 | 5.26 | 5.26 |
| Total Cash | 86,071.0 | 121,642.0 | 121,292.0 | 119,421.0 | 111,294.0 | 34,488.8 | 36,939.2 | 39,563.6 | 42,374.5 | 45,385.2 |
| Total Cash, percent | .0 | .0 | .0 | .0 | .0 | .0 | .0 | .0 | .0 | .0 |
| Account Receivables | 73,744.0 | 102,412.0 | 88,441.0 | 31,429.0 | 31,113.0 | 34,255.8 | 36,689.6 | 39,296.3 | 42,088.2 | 45,078.5 |
| Account Receivables, % | 182.18 | 140.38 | 294.12 | 100.16 | 96.62 | 99.32 | 99.32 | 99.32 | 99.32 | 99.32 |
| Inventories | 264.0 | 347.0 | 357.0 | 428.0 | 376.0 | 334.3 | 358.1 | 383.5 | 410.8 | 439.9 |
| Inventories, % | 0.65219 | 0.47564 | 1.19 | 1.36 | 1.17 | 0.96935 | 0.96935 | 0.96935 | 0.96935 | 0.96935 |
| Accounts Payable | 39,911.0 | 43,900.0 | 48,877.0 | 42,568.0 | 62,532.0 | 31,644.9 | 33,893.2 | 36,301.3 | 38,880.4 | 41,642.8 |
| Accounts Payable, % | 98.6 | 60.17 | 162.54 | 135.66 | 194.19 | 91.75 | 91.75 | 91.75 | 91.75 | 91.75 |
| Capital Expenditure | -3,207.0 | -2,855.0 | -2,180.0 | -697.0 | -595.0 | -1,597.2 | -1,710.6 | -1,832.2 | -1,962.3 | -2,101.8 |
| Capital Expenditure, % | -7.92 | -3.91 | -7.25 | -2.22 | -1.85 | -4.63 | -4.63 | -4.63 | -4.63 | -4.63 |
| Tax Rate, % | 50.53 | 50.53 | 50.53 | 50.53 | 50.53 | 50.53 | 50.53 | 50.53 | 50.53 | 50.53 |
| EBITAT | 7,625.4 | 18,631.1 | -6,007.8 | 6,031.9 | -4,870.7 | 1,248.5 | 1,337.2 | 1,432.2 | 1,533.9 | 1,642.9 |
| Depreciation | ||||||||||
| Changes in Account Receivables | ||||||||||
| Changes in Inventories | ||||||||||
| Changes in Accounts Payable | ||||||||||
| Capital Expenditure | ||||||||||
| UFCF | -26,041.6 | -5,365.9 | 14,382.2 | 59,726.9 | 19,021.3 | -30,825.1 | 3,178.6 | 3,404.4 | 3,646.3 | 3,905.3 |
| WACC, % | 7.26 | 7.23 | 7.23 | 7.76 | 6.87 | 7.27 | 7.27 | 7.27 | 7.27 | 7.27 |
| PV UFCF | ||||||||||
| SUM PV UFCF | -17,712.1 | |||||||||
| Long Term Growth Rate, % | 2.00 | |||||||||
| Free cash flow (T + 1) | 3,983 | |||||||||
| Terminal Value | 75,602 | |||||||||
| Present Terminal Value | 53,231 | |||||||||
| Enterprise Value | 35,519 | |||||||||
| Net Debt | 5,278 | |||||||||
| Equity Value | 30,241 | |||||||||
| Diluted Shares Outstanding, MM | 46 | |||||||||
| Equity Value Per Share | 653.12 |
What You'll Receive
- Comprehensive Digital Garage Financial Data: Pre-loaded with historical and forecasted data for accurate analysis.
- Customizable Template: Effortlessly adjust key variables like revenue growth, WACC, and EBITDA %.
- Instant Calculations: Observe the intrinsic value of Digital Garage update in real-time as you make adjustments.
- Professional Valuation Tool: Tailored for investors, analysts, and consultants aiming for precise DCF results.
- User-Friendly Interface: Intuitive layout and straightforward guidance suitable for all skill levels.
Key Features
- Comprehensive Data: Access Digital Garage, Inc.’s (4819T) historical financial statements along with pre-filled forecasts.
- Customizable Inputs: Adjust metrics such as WACC, tax rates, revenue growth, and EBITDA margins to fit your analysis.
- Real-Time Results: Watch as the intrinsic value of Digital Garage, Inc. (4819T) recalibrates instantaneously.
- Intuitive Visualizations: Use dashboard charts to view valuation results and essential metrics at a glance.
- Designed for Precision: A professional-grade tool tailored for analysts, investors, and finance professionals.
How It Works
- 1. Access the Template: Download and open the Excel file containing Digital Garage, Inc.’s preloaded financial data.
- 2. Modify Assumptions: Adjust essential inputs such as growth projections, WACC, and capital expenditures.
- 3. View Immediate Results: The DCF model instantly computes intrinsic value and NPV based on your inputs.
- 4. Explore Different Scenarios: Analyze various forecasts to evaluate different valuation outcomes.
- 5. Present with Assurance: Share professional valuation insights to bolster your strategic decisions.
Why Choose Digital Garage, Inc. (4819T) Calculator?
- All-in-One Solution: Features DCF, WACC, and a variety of financial ratio analyses in a single tool.
- Flexible Inputs: Modify the yellow-highlighted cells to explore different financial scenarios.
- In-Depth Analysis: Automatically determines the intrinsic value and Net Present Value for Digital Garage, Inc. (4819T).
- Loaded with Data: Comes with historical and projected data for reliable analysis.
- High-Quality Standards: Perfect for financial analysts, investors, and business advisors.
Who Can Benefit from Digital Garage, Inc. (4819T)?
- Individual Investors: Gain insights for making strategic decisions about investing in Digital Garage stock.
- Financial Analysts: Enhance valuation assessments with comprehensive, ready-to-use financial models.
- Consultants: Provide clients with accurate and professional valuation insights efficiently.
- Business Owners: Learn how major companies like Digital Garage are valued to inform your own business strategies.
- Finance Students: Study valuation methods using practical examples and real-time data.
Contents of the Template
- Operating and Balance Sheet Data: Pre-filled historical data and forecasts for Digital Garage, Inc. (4819T), including revenue, EBITDA, EBIT, and capital expenditures.
- WACC Calculation: A dedicated sheet for calculating the Weighted Average Cost of Capital (WACC), featuring parameters such as Beta, the risk-free rate, and the share price.
- DCF Valuation (Unlevered and Levered): Customizable Discounted Cash Flow models that display intrinsic value along with comprehensive calculations.
- Financial Statements: Pre-loaded annual and quarterly financial statements to facilitate in-depth analysis.
- Key Ratios: Includes profitability, leverage, and efficiency ratios specific to Digital Garage, Inc. (4819T).
- Dashboard and Charts: A visual overview of valuation outputs and assumptions, designed for easy analysis of results.
Disclaimer
All information, articles, and product details provided on this website are for general informational and educational purposes only. We do not claim any ownership over, nor do we intend to infringe upon, any trademarks, copyrights, logos, brand names, or other intellectual property mentioned or depicted on this site. Such intellectual property remains the property of its respective owners, and any references here are made solely for identification or informational purposes, without implying any affiliation, endorsement, or partnership.
We make no representations or warranties, express or implied, regarding the accuracy, completeness, or suitability of any content or products presented. Nothing on this website should be construed as legal, tax, investment, financial, medical, or other professional advice. In addition, no part of this site—including articles or product references—constitutes a solicitation, recommendation, endorsement, advertisement, or offer to buy or sell any securities, franchises, or other financial instruments, particularly in jurisdictions where such activity would be unlawful.
All content is of a general nature and may not address the specific circumstances of any individual or entity. It is not a substitute for professional advice or services. Any actions you take based on the information provided here are strictly at your own risk. You accept full responsibility for any decisions or outcomes arising from your use of this website and agree to release us from any liability in connection with your use of, or reliance upon, the content or products found herein.