
|
Milbon Co., Ltd. (4919.T) Avaliação DCF |
Totalmente Editável: Adapte-Se Às Suas Necessidades No Excel Ou Planilhas
Design Profissional: Modelos Confiáveis E Padrão Da Indústria
Pré-Construídos Para Uso Rápido E Eficiente
Compatível com MAC/PC, totalmente desbloqueado
Não É Necessária Experiência; Fácil De Seguir
Milbon Co., Ltd. (4919.T) Bundle
Simplifique sua análise e melhore a precisão com a nossa calculadora DCF (4919T)! Com os dados da Real Milbon Co., Ltd. e suposições personalizáveis, essa ferramenta o capacita a prever, avaliar e valorizar Milbon como um investidor experiente.
What You Will Receive
- Pre-Filled Financial Model: Milbon Co., Ltd.'s actual data allows for accurate DCF valuation.
- Comprehensive Forecast Control: Modify revenue growth, profit margins, WACC, and other essential factors.
- Real-Time Calculations: Automatic updates provide immediate results as adjustments are made.
- Investor-Ready Template: A polished Excel file crafted for high-quality valuation practices.
- Customizable and Reusable: Designed for adaptability, perfect for multiple detailed forecasting sessions.
Key Features
- Comprehensive Data: Milbon Co., Ltd.’s historical financial statements and pre-populated forecasts.
- Customizable Inputs: Adjust WACC, tax rates, revenue growth, and EBITDA margins as needed.
- Real-Time Results: View Milbon Co., Ltd.’s intrinsic value being recalculated instantly.
- Visual Performance Metrics: Dashboard charts illustrate valuation findings and essential metrics.
- Designed for Precision: A sophisticated tool aimed at analysts, investors, and finance professionals.
How It Works
- Step 1: Download the Excel file for Milbon Co., Ltd. (4919T).
- Step 2: Review the pre-filled data for Milbon (historical and projected).
- Step 3: Modify key assumptions (highlighted in yellow) according to your analysis.
- Step 4: Observe the automatic recalculations for Milbon’s intrinsic value.
- Step 5: Utilize the results for investment analysis or reporting.
Why Opt for This Calculator for Milbon Co., Ltd. (4919T)?
- All-in-One Solution: Combines DCF, WACC, and financial ratio analyses into a single tool.
- Flexible Inputs: Modify the yellow-highlighted cells to explore different scenarios.
- In-Depth Analysis: Automatically determines Milbon’s intrinsic value and Net Present Value.
- Pre-Loaded Data: Historical and projected data provide reliable starting points.
- Professional Standard: Perfect for financial analysts, investors, and business consultants.
Who Should Consider This Product?
- Individual Investors: Make well-informed choices regarding the purchase or sale of Milbon Co., Ltd. (4919T) stock.
- Financial Analysts: Enhance valuation processes with user-friendly financial models tailored for Milbon Co., Ltd. (4919T).
- Consultants: Provide clients with accurate and timely valuation insights related to Milbon Co., Ltd. (4919T).
- Business Owners: Gain insights into the valuation of companies like Milbon Co., Ltd. (4919T) to inform your strategic decisions.
- Finance Students: Acquire valuation skills using real-world examples and data from Milbon Co., Ltd. (4919T).
Contents of the Template
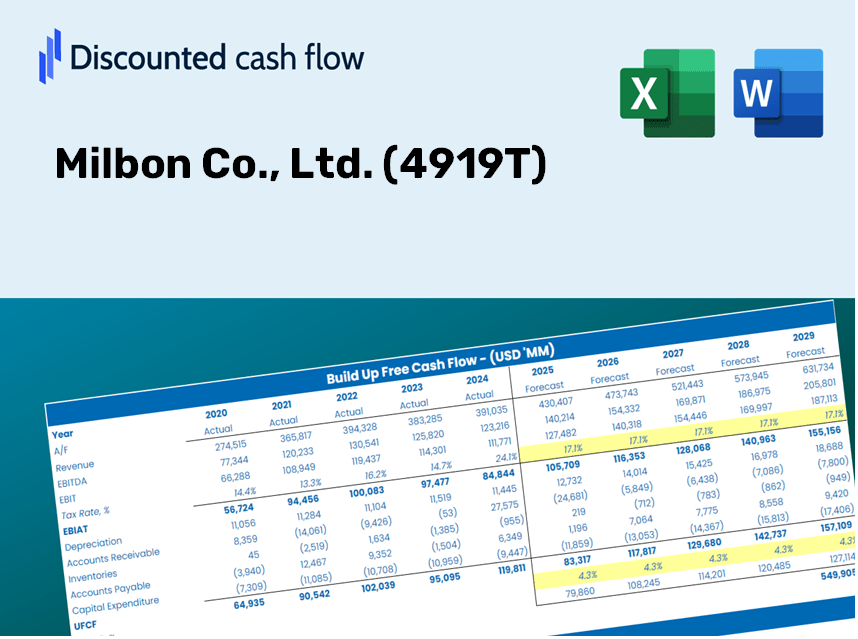
- Operating and Balance Sheet Data: Pre-filled historical data and forecasts for Milbon Co., Ltd. (4919T), including revenue, EBITDA, EBIT, and capital expenditures.
- WACC Calculation: A dedicated sheet for the Weighted Average Cost of Capital (WACC), featuring parameters such as Beta, risk-free rate, and share price.
- DCF Valuation (Unlevered and Levered): Customizable Discounted Cash Flow models illustrating intrinsic value with comprehensive calculations.
- Financial Statements: Pre-loaded financial statements (annual and quarterly) specifically for Milbon Co., Ltd. (4919T) to facilitate analysis.
- Key Ratios: Includes key financial ratios related to profitability, leverage, and efficiency for Milbon Co., Ltd. (4919T).
- Dashboard and Charts: A visual summary of valuation results and assumptions to simplify analysis.
Disclaimer
All information, articles, and product details provided on this website are for general informational and educational purposes only. We do not claim any ownership over, nor do we intend to infringe upon, any trademarks, copyrights, logos, brand names, or other intellectual property mentioned or depicted on this site. Such intellectual property remains the property of its respective owners, and any references here are made solely for identification or informational purposes, without implying any affiliation, endorsement, or partnership.
We make no representations or warranties, express or implied, regarding the accuracy, completeness, or suitability of any content or products presented. Nothing on this website should be construed as legal, tax, investment, financial, medical, or other professional advice. In addition, no part of this site—including articles or product references—constitutes a solicitation, recommendation, endorsement, advertisement, or offer to buy or sell any securities, franchises, or other financial instruments, particularly in jurisdictions where such activity would be unlawful.
All content is of a general nature and may not address the specific circumstances of any individual or entity. It is not a substitute for professional advice or services. Any actions you take based on the information provided here are strictly at your own risk. You accept full responsibility for any decisions or outcomes arising from your use of this website and agree to release us from any liability in connection with your use of, or reliance upon, the content or products found herein.