
|
Pola Orbis Holdings Inc. (4927.T) Avaliação DCF |
Totalmente Editável: Adapte-Se Às Suas Necessidades No Excel Ou Planilhas
Design Profissional: Modelos Confiáveis E Padrão Da Indústria
Pré-Construídos Para Uso Rápido E Eficiente
Compatível com MAC/PC, totalmente desbloqueado
Não É Necessária Experiência; Fácil De Seguir
Pola Orbis Holdings Inc. (4927.T) Bundle
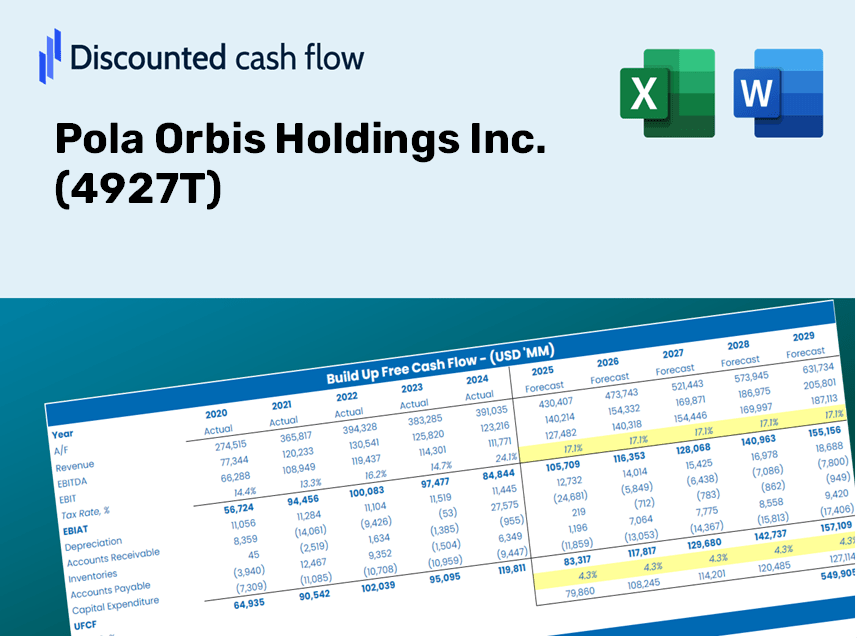
Procurando calcular o valor intrínseco da Pola Orbis Holdings Inc.? Nossa calculadora DCF (4927T) integra dados do mundo real com recursos abrangentes de personalização, permitindo ajustar as previsões e aprimorar suas estratégias de investimento.
What You Will Receive
- Authentic POLA Financials: Features historical and projected data for precise valuation.
- Customizable Parameters: Adjust WACC, tax rates, revenue growth, and capital expenditures to suit your analysis.
- Automated Calculations: Intrinsic value and NPV are computed in real-time.
- Scenario Testing: Explore various scenarios to assess Pola Orbis's future performance.
- User-Friendly Design: Crafted for professionals while remaining accessible to newcomers.
Key Features
- Advanced DCF Calculator: Features comprehensive unlevered and levered DCF valuation models tailored for Pola Orbis Holdings Inc. (4927T).
- WACC Calculator: Pre-designed Weighted Average Cost of Capital sheet with options for input customization.
- Editable Forecast Assumptions: Adjust growth rates, capital expenditures, and discount rates as needed.
- Built-In Financial Ratios: Evaluate profitability, leverage, and efficiency ratios specific to Pola Orbis Holdings Inc. (4927T).
- Dashboard and Charts: Visual representations summarize essential valuation metrics for streamlined analysis.
How It Works
- Download: Get the pre-prepared Excel file containing Pola Orbis Holdings Inc.'s (4927T) financial data.
- Customize: Tailor your forecasts, adjusting parameters such as revenue growth, EBITDA %, and WACC.
- Update Automatically: Watch as intrinsic value and NPV calculations refresh in real-time.
- Test Scenarios: Generate various projections and instantly compare the results.
- Make Decisions: Leverage the valuation insights to inform your investment strategy.
Why Opt for the Pola Orbis Holdings Inc. (4927T) Calculator?
- Time-Saving: Quickly access an optimized DCF model without starting from scratch.
- Enhanced Accuracy: Dependable financial data and calculations minimize valuation errors.
- Fully Adaptable: Customize the model to reflect your specific assumptions and forecasts.
- User-Friendly: Intuitive charts and outputs simplify data analysis and interpretation.
- Endorsed by Professionals: Crafted for experts who prioritize accuracy and functionality.
Who Should Utilize This Product?
- Investors: Accurately assess the fair value of Pola Orbis Holdings Inc. (4927T) prior to making investment choices.
- CFOs: Utilize a high-quality DCF model for financial analysis and reporting.
- Consultants: Easily customize the template for valuation reports tailored to client needs.
- Entrepreneurs: Acquire insights into financial modeling practices used by leading companies.
- Educators: Employ the tool as a resource for teaching valuation techniques.
Contents of the Template
- Pre-Filled Data: Features historical financials and forecasts for Pola Orbis Holdings Inc. (4927T).
- Discounted Cash Flow Model: An editable DCF valuation model equipped with automatic calculations.
- Weighted Average Cost of Capital (WACC): A specific sheet for computing WACC based on tailored inputs.
- Key Financial Ratios: Evaluate Pola Orbis Holdings Inc.'s profitability, efficiency, and leverage.
- Customizable Inputs: Easily modify revenue growth, margins, and tax rates.
- Clear Dashboard: Visuals and tables that encapsulate essential valuation results.
Disclaimer
All information, articles, and product details provided on this website are for general informational and educational purposes only. We do not claim any ownership over, nor do we intend to infringe upon, any trademarks, copyrights, logos, brand names, or other intellectual property mentioned or depicted on this site. Such intellectual property remains the property of its respective owners, and any references here are made solely for identification or informational purposes, without implying any affiliation, endorsement, or partnership.
We make no representations or warranties, express or implied, regarding the accuracy, completeness, or suitability of any content or products presented. Nothing on this website should be construed as legal, tax, investment, financial, medical, or other professional advice. In addition, no part of this site—including articles or product references—constitutes a solicitation, recommendation, endorsement, advertisement, or offer to buy or sell any securities, franchises, or other financial instruments, particularly in jurisdictions where such activity would be unlawful.
All content is of a general nature and may not address the specific circumstances of any individual or entity. It is not a substitute for professional advice or services. Any actions you take based on the information provided here are strictly at your own risk. You accept full responsibility for any decisions or outcomes arising from your use of this website and agree to release us from any liability in connection with your use of, or reliance upon, the content or products found herein.