
|
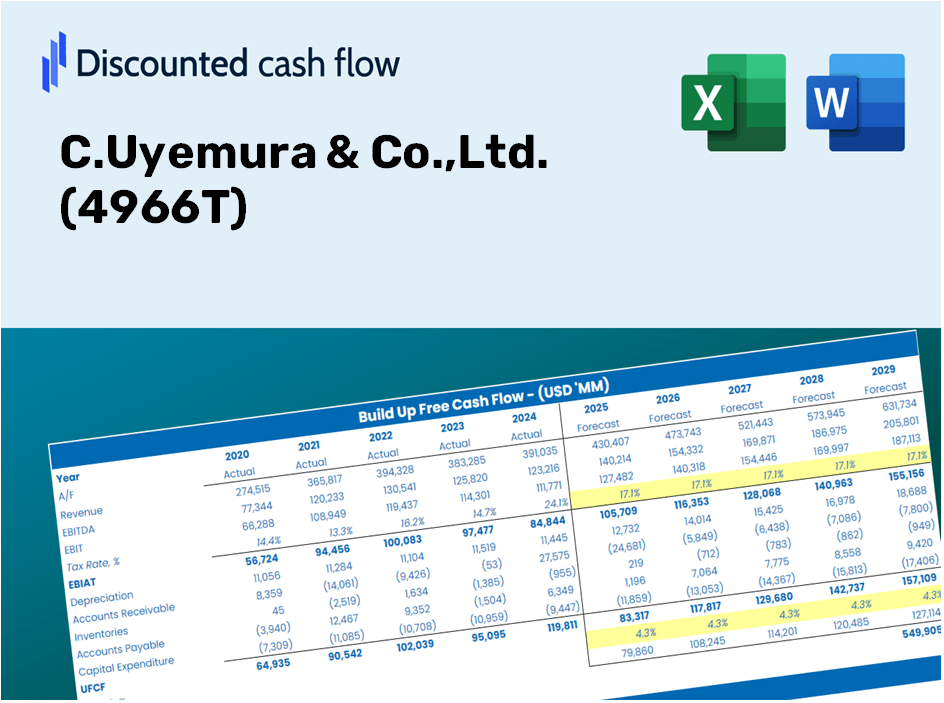
C.Uyemura & Co., Ltd. (4966.T) Avaliação do DCF |
Totalmente Editável: Adapte-Se Às Suas Necessidades No Excel Ou Planilhas
Design Profissional: Modelos Confiáveis E Padrão Da Indústria
Pré-Construídos Para Uso Rápido E Eficiente
Compatível com MAC/PC, totalmente desbloqueado
Não É Necessária Experiência; Fácil De Seguir
C.Uyemura & Co.,Ltd. (4966.T) Bundle
Aprimore suas opções de investimento com a calculadora DCF (4966T)! Revise a autêntica c.uyemura & Co., Ltd. Dados financeiros, ajustar as projeções e despesas de crescimento e observar instantaneamente os efeitos no valor intrínseco de (4966T).
Discounted Cash Flow (DCF) - (USD MM)
| Year | AY1 2021 |
AY2 2022 |
AY3 2023 |
AY4 2024 |
AY5 2025 |
FY1 2026 |
FY2 2027 |
FY3 2028 |
FY4 2029 |
FY5 2030 |
|---|---|---|---|---|---|---|---|---|---|---|
| Revenue | 55,947.4 | 72,303.6 | 85,749.4 | 80,256.0 | 83,845.4 | 93,466.2 | 104,190.8 | 116,146.1 | 129,473.1 | 144,329.3 |
| Revenue Growth, % | 0 | 29.24 | 18.6 | -6.41 | 4.47 | 11.47 | 11.47 | 11.47 | 11.47 | 11.47 |
| EBITDA | 12,002.8 | 15,999.0 | 17,594.7 | 17,808.3 | 22,396.1 | 21,123.4 | 23,547.2 | 26,249.1 | 29,261.0 | 32,618.6 |
| EBITDA, % | 21.45 | 22.13 | 20.52 | 22.19 | 26.71 | 22.6 | 22.6 | 22.6 | 22.6 | 22.6 |
| Depreciation | 2,066.6 | 1,913.2 | 2,025.2 | 1,991.9 | 2,262.7 | 2,595.0 | 2,892.8 | 3,224.7 | 3,594.7 | 4,007.2 |
| Depreciation, % | 3.69 | 2.65 | 2.36 | 2.48 | 2.7 | 2.78 | 2.78 | 2.78 | 2.78 | 2.78 |
| EBIT | 9,936.2 | 14,085.8 | 15,569.5 | 15,816.4 | 20,133.4 | 18,528.4 | 20,654.4 | 23,024.4 | 25,666.3 | 28,611.3 |
| EBIT, % | 17.76 | 19.48 | 18.16 | 19.71 | 24.01 | 19.82 | 19.82 | 19.82 | 19.82 | 19.82 |
| Total Cash | 30,585.3 | 31,104.3 | 32,657.7 | 38,221.4 | 52,152.6 | 45,910.1 | 51,178.0 | 57,050.3 | 63,596.5 | 70,893.8 |
| Total Cash, percent | .0 | .0 | .0 | .0 | .0 | .0 | .0 | .0 | .0 | .0 |
| Account Receivables | 15,714.7 | 20,665.0 | 20,468.9 | 25,641.9 | 22,999.1 | 26,155.6 | 29,156.8 | 32,502.4 | 36,231.8 | 40,389.2 |
| Account Receivables, % | 28.09 | 28.58 | 23.87 | 31.95 | 27.43 | 27.98 | 27.98 | 27.98 | 27.98 | 27.98 |
| Inventories | 6,283.2 | 10,955.4 | 11,198.5 | 9,463.1 | 9,198.4 | 11,627.9 | 12,962.2 | 14,449.5 | 16,107.5 | 17,955.7 |
| Inventories, % | 11.23 | 15.15 | 13.06 | 11.79 | 10.97 | 12.44 | 12.44 | 12.44 | 12.44 | 12.44 |
| Accounts Payable | 2,224.1 | 4,113.4 | 3,765.3 | 3,600.6 | 7,475.5 | 5,132.7 | 5,721.7 | 6,378.2 | 7,110.1 | 7,925.9 |
| Accounts Payable, % | 3.98 | 5.69 | 4.39 | 4.49 | 8.92 | 5.49 | 5.49 | 5.49 | 5.49 | 5.49 |
| Capital Expenditure | -1,351.0 | -2,717.0 | -6,089.0 | -2,315.0 | -2,201.0 | -3,511.2 | -3,914.0 | -4,363.2 | -4,863.8 | -5,421.9 |
| Capital Expenditure, % | -2.41 | -3.76 | -7.1 | -2.88 | -2.63 | -3.76 | -3.76 | -3.76 | -3.76 | -3.76 |
| Tax Rate, % | 29.99 | 29.99 | 29.99 | 29.99 | 29.99 | 29.99 | 29.99 | 29.99 | 29.99 | 29.99 |
| EBITAT | 7,135.2 | 9,694.3 | 10,555.1 | 10,930.8 | 14,094.5 | 12,878.8 | 14,356.6 | 16,003.9 | 17,840.3 | 19,887.4 |
| Depreciation | ||||||||||
| Changes in Account Receivables | ||||||||||
| Changes in Inventories | ||||||||||
| Changes in Accounts Payable | ||||||||||
| Capital Expenditure | ||||||||||
| UFCF | -11,923.0 | 1,157.4 | 6,096.1 | 7,005.6 | 20,938.5 | 4,033.8 | 9,588.9 | 10,689.1 | 11,915.7 | 13,282.9 |
| WACC, % | 7.78 | 7.78 | 7.78 | 7.78 | 7.78 | 7.78 | 7.78 | 7.78 | 7.78 | 7.78 |
| PV UFCF | ||||||||||
| SUM PV UFCF | 38,497.6 | |||||||||
| Long Term Growth Rate, % | 2.00 | |||||||||
| Free cash flow (T + 1) | 13,549 | |||||||||
| Terminal Value | 234,408 | |||||||||
| Present Terminal Value | 161,170 | |||||||||
| Enterprise Value | 199,667 | |||||||||
| Net Debt | -50,922 | |||||||||
| Equity Value | 250,589 | |||||||||
| Diluted Shares Outstanding, MM | 16 | |||||||||
| Equity Value Per Share | 15,536.55 |
What You Can Expect
- Comprehensive Financial Model: Leverage C.Uyemura & Co., Ltd.'s (4966T) actual data for accurate DCF valuation.
- Dynamic Forecasting Control: Modify key elements such as revenue growth, profit margins, WACC, and more.
- Real-Time Calculations: Enjoy automatic updates that reflect your changes instantly.
- Professional-Grade Template: A polished Excel file crafted for high-quality valuation analysis.
- Flexible and Reusable: Designed for adaptability, making it easy to generate in-depth forecasts multiple times.
Key Features
- Comprehensive C.Uyemura Data: Includes historical financials and future projections for C.Uyemura & Co., Ltd. (4966T).
- Customizable Parameters: Modify inputs such as revenue growth rates, profit margins, discount rates, tax assumptions, and capital investment plans.
- Interactive Valuation Model: Instant updates to Net Present Value (NPV) and intrinsic value based on your specified parameters.
- Scenario Analysis: Develop various forecast scenarios to evaluate different valuation results.
- User-Centric Interface: Intuitive and organized layout catering to both experienced professionals and newcomers.
How It Works
- 1. Access the Template: Download and open the Excel file featuring C.Uyemura & Co., Ltd.'s preloaded data.
- 2. Modify Assumptions: Update key inputs such as growth rates, WACC, and capital expenditures.
- 3. Instant Results: The DCF model automatically calculates intrinsic value and NPV.
- 4. Explore Scenarios: Compare various forecasts to examine different valuation results.
- 5. Present with Confidence: Share professional valuation insights to strengthen your decision-making.
Why Opt for C.Uyemura & Co., Ltd. [4966T] Calculator?
- Designed for Industry Experts: A sophisticated tool tailored for analysts, CFOs, and consultants.
- Accurate Financial Insights: Historical and projected financial data for C.Uyemura & Co., Ltd. preloaded for precision.
- Diverse Scenario Analysis: Effortlessly simulate various forecasts and assumptions.
- Detailed Results: Instantly computes intrinsic value, NPV, and other critical metrics.
- User-Friendly: Comprehensive step-by-step instructions facilitate seamless navigation.
Who Can Benefit from This Product?
- Investors: Determine the true value of C.Uyemura & Co., Ltd. (4966T) before making investment choices.
- CFOs: Utilize a top-tier DCF model for accurate financial reporting and analysis.
- Consultants: Efficiently customize the template for client valuation reports.
- Entrepreneurs: Acquire knowledge on financial modeling practices employed by leading firms.
- Educators: Implement it as a resource for teaching valuation techniques and methodologies.
Contents of the Template
- Operating and Balance Sheet Data: Pre-filled historical data and projections for C.Uyemura & Co., Ltd. (4966T), including revenue, EBITDA, EBIT, and capital expenditures.
- WACC Calculation: A dedicated sheet for calculating the Weighted Average Cost of Capital (WACC), featuring key parameters such as Beta, risk-free rate, and share price.
- DCF Valuation (Unlevered and Levered): Customizable Discounted Cash Flow models that detail intrinsic value along with comprehensive calculations.
- Financial Statements: Pre-loaded annual and quarterly financial statements to assist in analysis.
- Key Ratios: Provides profitability, leverage, and efficiency ratios specific to C.Uyemura & Co., Ltd. (4966T).
- Dashboard and Charts: An intuitive visual representation of valuation outputs and assumptions for streamlined analysis.
Disclaimer
All information, articles, and product details provided on this website are for general informational and educational purposes only. We do not claim any ownership over, nor do we intend to infringe upon, any trademarks, copyrights, logos, brand names, or other intellectual property mentioned or depicted on this site. Such intellectual property remains the property of its respective owners, and any references here are made solely for identification or informational purposes, without implying any affiliation, endorsement, or partnership.
We make no representations or warranties, express or implied, regarding the accuracy, completeness, or suitability of any content or products presented. Nothing on this website should be construed as legal, tax, investment, financial, medical, or other professional advice. In addition, no part of this site—including articles or product references—constitutes a solicitation, recommendation, endorsement, advertisement, or offer to buy or sell any securities, franchises, or other financial instruments, particularly in jurisdictions where such activity would be unlawful.
All content is of a general nature and may not address the specific circumstances of any individual or entity. It is not a substitute for professional advice or services. Any actions you take based on the information provided here are strictly at your own risk. You accept full responsibility for any decisions or outcomes arising from your use of this website and agree to release us from any liability in connection with your use of, or reliance upon, the content or products found herein.