
|
The Yokohama Rubber Co., Ltd. (5101.T) DCF Avaliação |
Totalmente Editável: Adapte-Se Às Suas Necessidades No Excel Ou Planilhas
Design Profissional: Modelos Confiáveis E Padrão Da Indústria
Pré-Construídos Para Uso Rápido E Eficiente
Compatível com MAC/PC, totalmente desbloqueado
Não É Necessária Experiência; Fácil De Seguir
The Yokohama Rubber Co., Ltd. (5101.T) Bundle
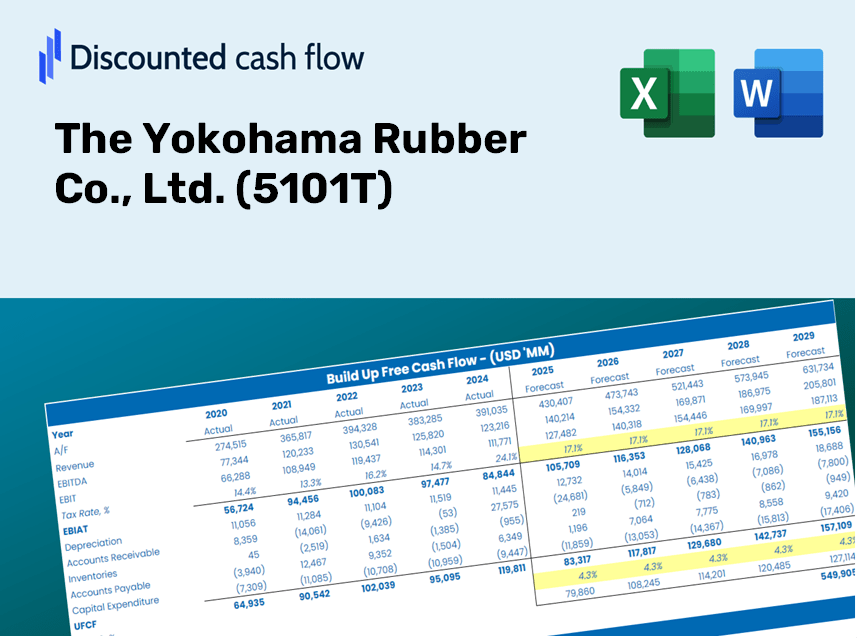
Simplifique a avaliação Yokohama Rubber Co., Ltd. (5101T) com esta calculadora DCF personalizável! Apresentando a Real The Yokohama Rubber Co., Ltd. (5101T) e entradas de previsão ajustável, você pode testar cenários e descobrir o valor justo Yokohama Rubber Co., Ltd. (5101T) em minutos.
Discounted Cash Flow (DCF) - (USD MM)
| Year | AY1 2020 |
AY2 2021 |
AY3 2022 |
AY4 2023 |
AY5 2024 |
FY1 2025 |
FY2 2026 |
FY3 2027 |
FY4 2028 |
FY5 2029 |
|---|---|---|---|---|---|---|---|---|---|---|
| Revenue | 551,090.0 | 670,809.0 | 860,477.0 | 985,333.0 | 1,094,746.0 | 1,083,708.0 | 1,072,781.3 | 1,061,964.7 | 1,051,257.3 | 1,040,657.7 |
| Revenue Growth, % | 0 | 21.72 | 28.27 | 14.51 | 11.1 | -1.01 | -1.01 | -1.01 | -1.01 | -1.01 |
| EBITDA | 81,134.0 | 133,236.0 | 125,380.0 | 172,611.0 | 186,930.0 | 181,518.2 | 179,688.0 | 177,876.3 | 176,082.8 | 174,307.4 |
| EBITDA, % | 14.72 | 19.86 | 14.57 | 17.52 | 17.08 | 16.75 | 16.75 | 16.75 | 16.75 | 16.75 |
| Depreciation | 44,467.0 | 45,560.0 | 49,914.0 | 59,494.0 | 66,157.0 | 70,966.7 | 70,251.2 | 69,542.9 | 68,841.7 | 68,147.6 |
| Depreciation, % | 8.07 | 6.79 | 5.8 | 6.04 | 6.04 | 6.55 | 6.55 | 6.55 | 6.55 | 6.55 |
| EBIT | 36,667.0 | 87,676.0 | 75,466.0 | 113,117.0 | 120,773.0 | 110,551.5 | 109,436.8 | 108,333.4 | 107,241.1 | 106,159.8 |
| EBIT, % | 6.65 | 13.07 | 8.77 | 11.48 | 11.03 | 10.2 | 10.2 | 10.2 | 10.2 | 10.2 |
| Total Cash | 30,760.0 | 42,523.0 | 75,572.0 | 97,613.0 | 145,274.0 | 95,106.2 | 94,147.3 | 93,198.0 | 92,258.4 | 91,328.1 |
| Total Cash, percent | .0 | .0 | .0 | .0 | .0 | .0 | .0 | .0 | .0 | .0 |
| Account Receivables | 152,390.0 | 169,869.0 | 193,749.0 | 243,393.0 | 281,020.0 | 272,798.4 | 270,047.8 | 267,325.0 | 264,629.7 | 261,961.5 |
| Account Receivables, % | 27.65 | 25.32 | 22.52 | 24.7 | 25.67 | 25.17 | 25.17 | 25.17 | 25.17 | 25.17 |
| Inventories | 112,572.0 | 152,700.0 | 216,392.0 | 249,721.0 | 280,633.0 | 258,609.5 | 256,002.0 | 253,420.8 | 250,865.7 | 248,336.3 |
| Inventories, % | 20.43 | 22.76 | 25.15 | 25.34 | 25.63 | 23.86 | 23.86 | 23.86 | 23.86 | 23.86 |
| Accounts Payable | 67,179.0 | 71,945.0 | 78,131.0 | 105,239.0 | 108,517.0 | 113,980.8 | 112,831.6 | 111,694.0 | 110,567.8 | 109,453.0 |
| Accounts Payable, % | 12.19 | 10.73 | 9.08 | 10.68 | 9.91 | 10.52 | 10.52 | 10.52 | 10.52 | 10.52 |
| Capital Expenditure | -31,281.0 | -36,300.0 | -54,892.0 | -58,726.0 | -76,965.0 | -66,013.5 | -65,347.9 | -64,689.0 | -64,036.8 | -63,391.1 |
| Capital Expenditure, % | -5.68 | -5.41 | -6.38 | -5.96 | -7.03 | -6.09 | -6.09 | -6.09 | -6.09 | -6.09 |
| Tax Rate, % | 35.06 | 35.06 | 35.06 | 35.06 | 35.06 | 35.06 | 35.06 | 35.06 | 35.06 | 35.06 |
| EBITAT | 28,806.3 | 67,404.3 | 48,382.4 | 71,765.1 | 78,435.8 | 76,930.7 | 76,155.0 | 75,387.2 | 74,627.0 | 73,874.6 |
| Depreciation | ||||||||||
| Changes in Account Receivables | ||||||||||
| Changes in Inventories | ||||||||||
| Changes in Accounts Payable | ||||||||||
| Capital Expenditure | ||||||||||
| UFCF | -155,790.7 | 23,823.3 | -37,981.6 | 16,668.1 | 2,366.8 | 117,592.8 | 85,267.1 | 84,407.3 | 83,556.3 | 82,713.8 |
| WACC, % | 4.11 | 4.09 | 3.93 | 3.92 | 3.94 | 4 | 4 | 4 | 4 | 4 |
| PV UFCF | ||||||||||
| SUM PV UFCF | 406,352.6 | |||||||||
| Long Term Growth Rate, % | 3.00 | |||||||||
| Free cash flow (T + 1) | 85,195 | |||||||||
| Terminal Value | 8,520,804 | |||||||||
| Present Terminal Value | 7,003,531 | |||||||||
| Enterprise Value | 7,409,883 | |||||||||
| Net Debt | 301,807 | |||||||||
| Equity Value | 7,108,076 | |||||||||
| Diluted Shares Outstanding, MM | 161 | |||||||||
| Equity Value Per Share | 44,266.39 |
What You Will Receive
- Genuine 5101T Financials: Comprehensive historical and projected data for precise valuation.
- Customizable Parameters: Adjust WACC, tax rates, revenue growth, and capital expenditures to suit your analysis.
- Real-Time Calculations: Dynamic computation of intrinsic value and NPV.
- Scenario Planning: Explore various scenarios to assess Yokohama Rubber's future performance.
- User-Friendly Design: Created for experts while remaining approachable for newcomers.
Key Features
- 🔍 Real-Life YOKOHAMA Financials: Pre-filled historical and projected data for The Yokohama Rubber Co., Ltd. (5101T).
- ✏️ Fully Customizable Inputs: Modify all essential parameters (yellow cells) such as WACC, growth %, and tax rates.
- 📊 Professional DCF Valuation: Integrated formulas calculate the intrinsic value of Yokohama using the Discounted Cash Flow method.
- ⚡ Instant Results: Visualize Yokohama’s valuation immediately after adjustments are made.
- Scenario Analysis: Explore and compare outcomes for different financial assumptions side-by-side.
How It Works
- Download the Template: Gain immediate access to the Excel-based Yokohama Rubber Co. DCF Calculator for [5101T].
- Input Your Assumptions: Modify the yellow-highlighted cells to set your growth rates, WACC, margins, and other variables.
- Instant Calculations: The model will automatically calculate the intrinsic value of Yokohama Rubber Co.
- Test Scenarios: Experiment with various assumptions to see how they impact the valuation.
- Analyze and Decide: Utilize the outcomes to inform your investment or financial strategy.
Why Opt for This Calculator?
- User-Friendly and Accessible: Crafted for both novices and seasoned users.
- Customizable Inputs: Easily adjust parameters to suit your analysis needs.
- Real-Time Updates: Observe immediate changes to Yokohama Rubber's valuation as you make adjustments.
- Pre-Configured: Comes loaded with Yokohama Rubber’s actual financial data for swift evaluations.
- Relied Upon by Experts: Favored by investors and analysts for making well-informed choices.
Who Can Benefit from Our Products?
- Investors: Gain confidence in your choices with our professional-grade valuation tools for (5101T).
- Financial Analysts: Increase efficiency with our customizable pre-built DCF models for (5101T).
- Consultants: Effortlessly modify templates for client presentations or reports related to (5101T).
- Finance Enthusiasts: Enhance your knowledge of valuation methods through practical, real-world applications involving (5101T).
- Educators and Students: Utilize our resources as effective teaching tools in finance courses pertaining to (5101T).
Contents of the Template
- Pre-Filled DCF Model: The Yokohama Rubber Co., Ltd.'s financial data (5101T) preloaded for immediate analysis.
- WACC Calculator: Comprehensive calculations for the Weighted Average Cost of Capital.
- Financial Ratios: Assess The Yokohama Rubber Co., Ltd.'s profitability, leverage, and operational efficiency.
- Editable Inputs: Customize assumptions such as growth rates, profit margins, and CAPEX to suit your analysis.
- Financial Statements: Annual and quarterly reports to facilitate in-depth evaluation.
- Interactive Dashboard: Effortlessly visualize essential valuation metrics and outcomes.
Disclaimer
All information, articles, and product details provided on this website are for general informational and educational purposes only. We do not claim any ownership over, nor do we intend to infringe upon, any trademarks, copyrights, logos, brand names, or other intellectual property mentioned or depicted on this site. Such intellectual property remains the property of its respective owners, and any references here are made solely for identification or informational purposes, without implying any affiliation, endorsement, or partnership.
We make no representations or warranties, express or implied, regarding the accuracy, completeness, or suitability of any content or products presented. Nothing on this website should be construed as legal, tax, investment, financial, medical, or other professional advice. In addition, no part of this site—including articles or product references—constitutes a solicitation, recommendation, endorsement, advertisement, or offer to buy or sell any securities, franchises, or other financial instruments, particularly in jurisdictions where such activity would be unlawful.
All content is of a general nature and may not address the specific circumstances of any individual or entity. It is not a substitute for professional advice or services. Any actions you take based on the information provided here are strictly at your own risk. You accept full responsibility for any decisions or outcomes arising from your use of this website and agree to release us from any liability in connection with your use of, or reliance upon, the content or products found herein.