
|
Asahi Holdings, Inc. (5857.T) Avaliação DCF |
Totalmente Editável: Adapte-Se Às Suas Necessidades No Excel Ou Planilhas
Design Profissional: Modelos Confiáveis E Padrão Da Indústria
Pré-Construídos Para Uso Rápido E Eficiente
Compatível com MAC/PC, totalmente desbloqueado
Não É Necessária Experiência; Fácil De Seguir
Asahi Holdings, Inc. (5857.T) Bundle
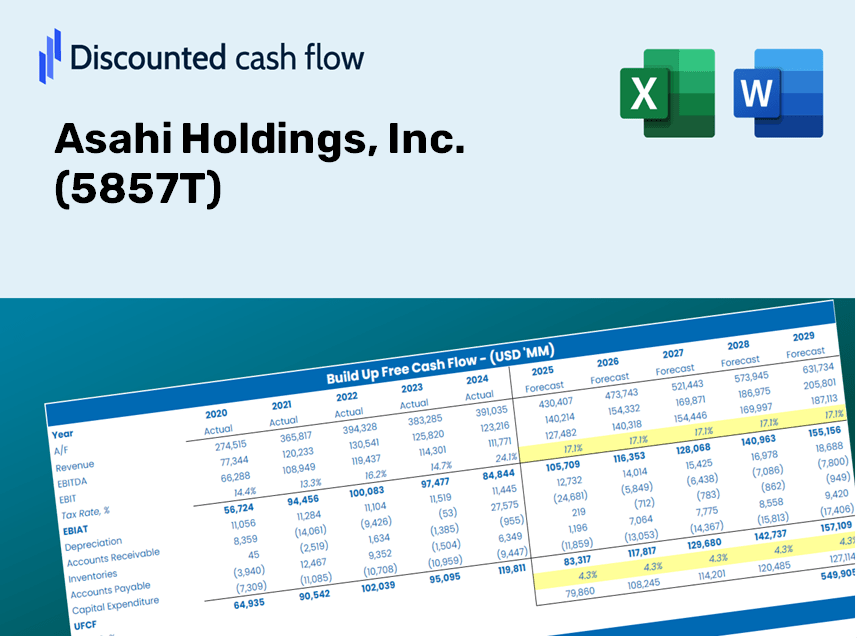
Seja você um investidor ou analista, esta calculadora DCF (5857T) é a ferramenta ideal para uma avaliação precisa. Pré-carregado com dados reais da Asahi Holdings, Inc., você pode ajustar as previsões e observar os efeitos em tempo real.
Discounted Cash Flow (DCF) - (USD MM)
| Year | AY1 2020 |
AY2 2021 |
AY3 2022 |
AY4 2023 |
AY5 2024 |
FY1 2025 |
FY2 2026 |
FY3 2027 |
FY4 2028 |
FY5 2029 |
|---|---|---|---|---|---|---|---|---|---|---|
| Revenue | 164,776.0 | 192,442.0 | 274,209.0 | 322,253.0 | 506,211.0 | 675,646.3 | 901,793.8 | 1,203,635.8 | 1,606,508.1 | 2,144,227.0 |
| Revenue Growth, % | 0 | 16.79 | 42.49 | 17.52 | 57.08 | 33.47 | 33.47 | 33.47 | 33.47 | 33.47 |
| EBITDA | 29,426.0 | 28,968.0 | 16,713.0 | 17,135.0 | 21,510.0 | 65,635.6 | 87,604.7 | 116,927.2 | 156,064.2 | 208,300.9 |
| EBITDA, % | 17.86 | 15.05 | 6.09 | 5.32 | 4.25 | 9.71 | 9.71 | 9.71 | 9.71 | 9.71 |
| Depreciation | 2,538.0 | 2,689.0 | 3,313.0 | 3,632.0 | 2,764.0 | 7,863.0 | 10,494.8 | 14,007.6 | 18,696.1 | 24,953.9 |
| Depreciation, % | 1.54 | 1.4 | 1.21 | 1.13 | 0.54602 | 1.16 | 1.16 | 1.16 | 1.16 | 1.16 |
| EBIT | 26,888.0 | 26,279.0 | 13,400.0 | 13,503.0 | 18,746.0 | 57,772.7 | 77,109.9 | 102,919.6 | 137,368.1 | 183,346.9 |
| EBIT, % | 16.32 | 13.66 | 4.89 | 4.19 | 3.7 | 8.55 | 8.55 | 8.55 | 8.55 | 8.55 |
| Total Cash | 12,192.0 | 6,256.0 | 21,561.0 | 6,881.0 | 17,555.0 | 32,588.0 | 43,495.6 | 58,054.2 | 77,485.6 | 103,421.1 |
| Total Cash, percent | .0 | .0 | .0 | .0 | .0 | .0 | .0 | .0 | .0 | .0 |
| Account Receivables | 100,775.0 | 151,437.0 | 154,046.0 | 155,268.0 | 304,306.0 | 411,233.3 | 548,878.4 | 732,595.0 | 977,803.9 | 1,305,087.5 |
| Account Receivables, % | 61.16 | 78.69 | 56.18 | 48.18 | 60.11 | 60.87 | 60.87 | 60.87 | 60.87 | 60.87 |
| Inventories | 63,515.0 | 63,398.0 | 40,854.0 | 33,879.0 | 51,178.0 | 144,604.9 | 193,006.0 | 257,607.6 | 343,832.1 | 458,917.1 |
| Inventories, % | 38.55 | 32.94 | 14.9 | 10.51 | 10.11 | 21.4 | 21.4 | 21.4 | 21.4 | 21.4 |
| Accounts Payable | 26,465.0 | 27,711.0 | 26,024.0 | 23,985.0 | 45,096.0 | 76,081.7 | 101,547.2 | 135,536.3 | 180,902.1 | 241,452.3 |
| Accounts Payable, % | 16.06 | 14.4 | 9.49 | 7.44 | 8.91 | 11.26 | 11.26 | 11.26 | 11.26 | 11.26 |
| Capital Expenditure | -5,420.0 | -8,757.0 | -5,130.0 | -8,417.0 | -7,423.0 | -18,632.9 | -24,869.5 | -33,193.7 | -44,304.0 | -59,133.1 |
| Capital Expenditure, % | -3.29 | -4.55 | -1.87 | -2.61 | -1.47 | -2.76 | -2.76 | -2.76 | -2.76 | -2.76 |
| Tax Rate, % | 30.1 | 30.1 | 30.1 | 30.1 | 30.1 | 30.1 | 30.1 | 30.1 | 30.1 | 30.1 |
| EBITAT | 26,465.2 | 18,668.9 | 11,577.9 | 26,612.6 | 13,103.8 | 49,196.0 | 65,662.6 | 87,640.7 | 116,975.1 | 156,128.2 |
| Depreciation | ||||||||||
| Changes in Account Receivables | ||||||||||
| Changes in Inventories | ||||||||||
| Changes in Accounts Payable | ||||||||||
| Capital Expenditure | ||||||||||
| UFCF | -114,241.8 | -36,698.1 | 28,008.9 | 25,541.6 | -136,781.2 | -130,942.3 | -109,292.8 | -145,874.5 | -194,700.5 | -259,869.3 |
| WACC, % | 3.94 | 3.37 | 3.69 | 3.98 | 3.34 | 3.66 | 3.66 | 3.66 | 3.66 | 3.66 |
| PV UFCF | ||||||||||
| SUM PV UFCF | -744,647.6 | |||||||||
| Long Term Growth Rate, % | 2.00 | |||||||||
| Free cash flow (T + 1) | -265,067 | |||||||||
| Terminal Value | -15,931,987 | |||||||||
| Present Terminal Value | -13,308,699 | |||||||||
| Enterprise Value | -14,053,346 | |||||||||
| Net Debt | 272,307 | |||||||||
| Equity Value | -14,325,653 | |||||||||
| Diluted Shares Outstanding, MM | 86 | |||||||||
| Equity Value Per Share | -166,457.35 |
What You Will Receive
- Customizable Excel Template: A fully editable Excel-based DCF Calculator featuring pre-filled financial data for Asahi Holdings, Inc. (5857T).
- Real-World Insights: Access to historical data and forward-looking projections (as indicated in the highlighted cells).
- Flexible Forecasting: Adapt forecast assumptions such as revenue growth, EBITDA %, and WACC as needed.
- Instant Calculations: Quickly observe the effect of your input variables on the valuation of Asahi Holdings, Inc. (5857T).
- Professional Resource: Designed specifically for investors, CFOs, consultants, and financial analysts.
- Intuitive Design: Organized for simplicity and ease of navigation, complete with step-by-step guidance.
Key Features
- Comprehensive DCF Calculator: Features detailed unlevered and levered DCF valuation models tailored for Asahi Holdings, Inc. (5857T).
- WACC Calculator: Ready-to-use Weighted Average Cost of Capital sheet with flexible input options.
- Customizable Forecast Assumptions: Adjust growth rates, capital expenditures, and discount rates as needed.
- Integrated Financial Ratios: Evaluate profitability, leverage, and efficiency ratios specifically for Asahi Holdings, Inc. (5857T).
- Dashboard and Visual Charts: Graphical representations that summarize essential valuation metrics for straightforward analysis.
How It Functions
- Download the Template: Gain immediate access to the Excel-based Asahi Holdings, Inc. (5857T) DCF Calculator.
- Input Your Assumptions: Modify the yellow-highlighted cells for growth rates, WACC, margins, and additional variables.
- Instant Calculations: The model automatically recalculates Asahi Holdings, Inc.'s (5857T) intrinsic value.
- Test Scenarios: Experiment with various assumptions to assess potential changes in valuation.
- Analyze and Decide: Utilize the findings to inform your investment or financial decision-making.
Why Opt for Asahi Holdings, Inc. ([5857T]) Calculator?
- Time Efficient: Skip the hassle of building a DCF model from the ground up – it's fully prepared for you.
- Enhanced Accuracy: Dependable financial data and formulas minimize valuation errors.
- Completely Customizable: Adjust the model to align with your specific assumptions and forecasts.
- User-Friendly: Intuitive charts and outputs simplify the analysis of results.
- Endorsed by Professionals: Crafted for experts who prioritize precision and ease of use.
Who Can Benefit from This Product?
- Finance Students: Master valuation methodologies and practice them with actual data.
- Researchers: Integrate professional valuation models into your studies or academic papers.
- Investors: Examine your own assumptions and assess the valuation results for Asahi Holdings, Inc. (5857T).
- Financial Analysts: Enhance your efficiency with a pre-built, adaptable DCF model.
- Entrepreneurs: Discover how major public firms like Asahi Holdings, Inc. (5857T) are evaluated.
What the Template Includes
- Preloaded ASAHI Data: Historical and forecasted financial information, encompassing revenue, EBIT, and capital expenditures.
- DCF and WACC Models: Advanced sheets designed to calculate intrinsic value and Weighted Average Cost of Capital.
- Editable Inputs: Yellow-highlighted cells for customizing revenue growth, tax rates, and discount rates.
- Financial Statements: Detailed annual and quarterly financial reports for in-depth analysis.
- Key Ratios: Profitability, leverage, and efficiency ratios for performance assessment.
- Dashboard and Charts: Visual representations of valuation results and underlying assumptions.
Disclaimer
All information, articles, and product details provided on this website are for general informational and educational purposes only. We do not claim any ownership over, nor do we intend to infringe upon, any trademarks, copyrights, logos, brand names, or other intellectual property mentioned or depicted on this site. Such intellectual property remains the property of its respective owners, and any references here are made solely for identification or informational purposes, without implying any affiliation, endorsement, or partnership.
We make no representations or warranties, express or implied, regarding the accuracy, completeness, or suitability of any content or products presented. Nothing on this website should be construed as legal, tax, investment, financial, medical, or other professional advice. In addition, no part of this site—including articles or product references—constitutes a solicitation, recommendation, endorsement, advertisement, or offer to buy or sell any securities, franchises, or other financial instruments, particularly in jurisdictions where such activity would be unlawful.
All content is of a general nature and may not address the specific circumstances of any individual or entity. It is not a substitute for professional advice or services. Any actions you take based on the information provided here are strictly at your own risk. You accept full responsibility for any decisions or outcomes arising from your use of this website and agree to release us from any liability in connection with your use of, or reliance upon, the content or products found herein.