
|
Rinnai Corporation (5947.T) Avaliação DCF |
Totalmente Editável: Adapte-Se Às Suas Necessidades No Excel Ou Planilhas
Design Profissional: Modelos Confiáveis E Padrão Da Indústria
Pré-Construídos Para Uso Rápido E Eficiente
Compatível com MAC/PC, totalmente desbloqueado
Não É Necessária Experiência; Fácil De Seguir
Rinnai Corporation (5947.T) Bundle
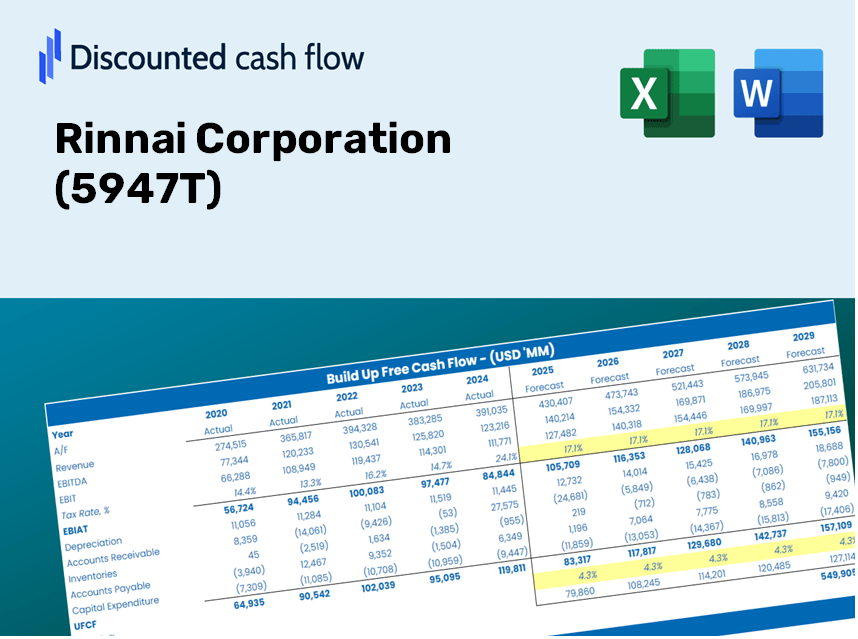
Projetado para precisão, nossa calculadora DCF (5947T) permite avaliar a avaliação da Rinnai Corporation usando informações financeiras atualizadas e oferece flexibilidade completa para modificar todos os parâmetros essenciais para melhorar projeções.
Discounted Cash Flow (DCF) - (USD MM)
| Year | AY1 2021 |
AY2 2022 |
AY3 2023 |
AY4 2024 |
AY5 2025 |
FY1 2026 |
FY2 2027 |
FY3 2028 |
FY4 2029 |
FY5 2030 |
|---|---|---|---|---|---|---|---|---|---|---|
| Revenue | 344,364.0 | 366,185.0 | 425,229.0 | 430,186.0 | 460,319.0 | 495,569.2 | 533,518.7 | 574,374.3 | 618,358.6 | 665,711.0 |
| Revenue Growth, % | 0 | 6.34 | 16.12 | 1.17 | 7 | 7.66 | 7.66 | 7.66 | 7.66 | 7.66 |
| EBITDA | 55,471.0 | 50,962.0 | 58,004.0 | 60,879.0 | 65,127.0 | 71,328.2 | 76,790.3 | 82,670.8 | 89,001.5 | 95,817.0 |
| EBITDA, % | 16.11 | 13.92 | 13.64 | 14.15 | 14.15 | 14.39 | 14.39 | 14.39 | 14.39 | 14.39 |
| Depreciation | 11,574.0 | 11,839.0 | 13,364.0 | 14,877.0 | 15,141.0 | 16,338.3 | 17,589.4 | 18,936.4 | 20,386.5 | 21,947.6 |
| Depreciation, % | 3.36 | 3.23 | 3.14 | 3.46 | 3.29 | 3.3 | 3.3 | 3.3 | 3.3 | 3.3 |
| EBIT | 43,897.0 | 39,123.0 | 44,640.0 | 46,002.0 | 49,986.0 | 54,989.9 | 59,200.9 | 63,734.4 | 68,615.0 | 73,869.4 |
| EBIT, % | 12.75 | 10.68 | 10.5 | 10.69 | 10.86 | 11.1 | 11.1 | 11.1 | 11.1 | 11.1 |
| Total Cash | 204,934.0 | 185,485.0 | 158,620.0 | 155,668.0 | 176,813.0 | 220,095.8 | 236,950.2 | 255,095.3 | 274,629.9 | 295,660.4 |
| Total Cash, percent | .0 | .0 | .0 | .0 | .0 | .0 | .0 | .0 | .0 | .0 |
| Account Receivables | 81,596.0 | 79,144.0 | 83,930.0 | 91,694.0 | 100,411.0 | 107,215.1 | 115,425.4 | 124,264.4 | 133,780.3 | 144,024.9 |
| Account Receivables, % | 23.69 | 21.61 | 19.74 | 21.31 | 21.81 | 21.63 | 21.63 | 21.63 | 21.63 | 21.63 |
| Inventories | 43,090.0 | 64,626.0 | 92,827.0 | 81,652.0 | 78,352.0 | 87,213.4 | 93,892.0 | 101,082.0 | 108,822.6 | 117,156.0 |
| Inventories, % | 12.51 | 17.65 | 21.83 | 18.98 | 17.02 | 17.6 | 17.6 | 17.6 | 17.6 | 17.6 |
| Accounts Payable | 55,501.0 | 59,726.0 | 64,056.0 | 24,427.0 | 50,803.0 | 63,636.9 | 68,510.1 | 73,756.4 | 79,404.5 | 85,485.1 |
| Accounts Payable, % | 16.12 | 16.31 | 15.06 | 5.68 | 11.04 | 12.84 | 12.84 | 12.84 | 12.84 | 12.84 |
| Capital Expenditure | -13,281.0 | -20,839.0 | -26,709.0 | -37,360.0 | -16,843.0 | -27,922.5 | -30,060.8 | -32,362.8 | -34,841.0 | -37,509.1 |
| Capital Expenditure, % | -3.86 | -5.69 | -6.28 | -8.68 | -3.66 | -5.63 | -5.63 | -5.63 | -5.63 | -5.63 |
| Tax Rate, % | 40.48 | 40.48 | 40.48 | 40.48 | 40.48 | 40.48 | 40.48 | 40.48 | 40.48 | 40.48 |
| EBITAT | 27,613.1 | 23,786.3 | 26,139.9 | 26,714.0 | 29,750.5 | 32,977.4 | 35,502.7 | 38,221.4 | 41,148.3 | 44,299.4 |
| Depreciation | ||||||||||
| Changes in Account Receivables | ||||||||||
| Changes in Inventories | ||||||||||
| Changes in Accounts Payable | ||||||||||
| Capital Expenditure | ||||||||||
| UFCF | -43,278.9 | -72.7 | -15,862.1 | -31,987.0 | 49,007.5 | 18,561.5 | 13,015.6 | 14,012.3 | 15,085.4 | 16,240.6 |
| WACC, % | 6.22 | 6.22 | 6.22 | 6.22 | 6.22 | 6.22 | 6.22 | 6.22 | 6.22 | 6.22 |
| PV UFCF | ||||||||||
| SUM PV UFCF | 64,567.7 | |||||||||
| Long Term Growth Rate, % | 0.50 | |||||||||
| Free cash flow (T + 1) | 16,322 | |||||||||
| Terminal Value | 285,463 | |||||||||
| Present Terminal Value | 211,138 | |||||||||
| Enterprise Value | 275,706 | |||||||||
| Net Debt | -170,846 | |||||||||
| Equity Value | 446,552 | |||||||||
| Diluted Shares Outstanding, MM | 142 | |||||||||
| Equity Value Per Share | 3,153.32 |
What You Will Receive
- Adjustable Forecast Inputs: Effortlessly modify assumptions (growth %, margins, WACC) to explore various scenarios.
- Real-World Data: Rinnai Corporation’s financial data pre-loaded to kickstart your analysis.
- Automated DCF Outputs: The template calculates Net Present Value (NPV) and intrinsic value automatically for you.
- Customizable and Professional: A sleek Excel model that caters to your valuation requirements.
- Designed for Analysts and Investors: Perfect for evaluating projections, validating strategies, and enhancing efficiency.
Key Features
- Comprehensive DCF Calculator: Offers detailed unlevered and levered DCF valuation models tailored for Rinnai Corporation (5947T).
- WACC Calculator: Features a pre-configured Weighted Average Cost of Capital sheet with adjustable inputs specific to Rinnai Corporation (5947T).
- Customizable Forecast Assumptions: Easily adjust growth rates, capital expenditures, and discount rates for Rinnai Corporation (5947T).
- Integrated Financial Ratios: Evaluate profitability, leverage, and efficiency ratios relevant to Rinnai Corporation (5947T).
- Interactive Dashboard and Charts: Visual representations summarizing essential valuation metrics for straightforward analysis of Rinnai Corporation (5947T).
How It Works
- Step 1: Download the Excel file.
- Step 2: Review the pre-filled Rinnai Corporation (5947T) data (historical and projected).
- Step 3: Modify key assumptions (yellow cells) according to your insights.
- Step 4: Observe automatic recalculations for Rinnai Corporation’s intrinsic value.
- Step 5: Utilize the results for investment strategies or reporting.
Why Opt for the Rinnai Corporation Calculator?
- Time-Efficient: Jump straight into calculations without building a DCF model from the ground up.
- Enhanced Accuracy: Dependable financial data and formulas minimize valuation errors.
- Completely Customizable: Adjust the model to align with your specific assumptions and forecasts.
- Easy to Understand: Intuitive charts and outputs facilitate straightforward analysis of results.
- Expert-Approved: Crafted for professionals who prioritize both precision and user-friendliness.
Who Can Benefit from Rinnai Corporation's Products?
- Investors: Make informed choices with a reliable and professional-grade valuation tool.
- Financial Analysts: Enhance efficiency with a ready-to-customize DCF model.
- Consultants: Easily modify the template for client presentations or reports.
- Finance Enthusiasts: Expand your knowledge of valuation techniques through real-world examples.
- Educators and Students: Utilize it as a hands-on learning resource in finance courses.
Contents of the Template
- In-Depth DCF Model: Editable template featuring comprehensive valuation computations.
- Real-World Data: Rinnai Corporation’s historical and projected financials preloaded for in-depth analysis.
- Customizable Parameters: Modify WACC, growth rates, and tax assumptions to explore various scenarios.
- Financial Statements: Complete annual and quarterly breakdowns for enhanced insights.
- Key Ratios: Integrated analysis for profitability, efficiency, and leverage metrics.
- Dashboard with Visual Outputs: Charts and tables providing clear, actionable insights.
Disclaimer
All information, articles, and product details provided on this website are for general informational and educational purposes only. We do not claim any ownership over, nor do we intend to infringe upon, any trademarks, copyrights, logos, brand names, or other intellectual property mentioned or depicted on this site. Such intellectual property remains the property of its respective owners, and any references here are made solely for identification or informational purposes, without implying any affiliation, endorsement, or partnership.
We make no representations or warranties, express or implied, regarding the accuracy, completeness, or suitability of any content or products presented. Nothing on this website should be construed as legal, tax, investment, financial, medical, or other professional advice. In addition, no part of this site—including articles or product references—constitutes a solicitation, recommendation, endorsement, advertisement, or offer to buy or sell any securities, franchises, or other financial instruments, particularly in jurisdictions where such activity would be unlawful.
All content is of a general nature and may not address the specific circumstances of any individual or entity. It is not a substitute for professional advice or services. Any actions you take based on the information provided here are strictly at your own risk. You accept full responsibility for any decisions or outcomes arising from your use of this website and agree to release us from any liability in connection with your use of, or reliance upon, the content or products found herein.