
|
Beijing Capital Eco-Ambiente Protection Group Co., Ltd. (600008.SS) Avaliação do DCF |
Totalmente Editável: Adapte-Se Às Suas Necessidades No Excel Ou Planilhas
Design Profissional: Modelos Confiáveis E Padrão Da Indústria
Pré-Construídos Para Uso Rápido E Eficiente
Compatível com MAC/PC, totalmente desbloqueado
Não É Necessária Experiência; Fácil De Seguir
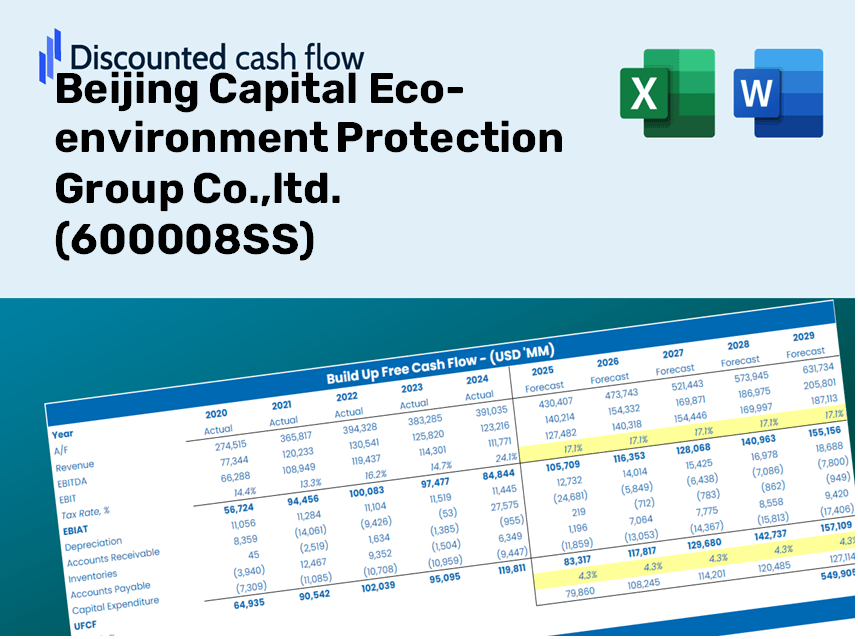
Beijing Capital Eco-environment Protection Group Co.,ltd. (600008.SS) Bundle
Economize tempo e melhore a precisão com nossa calculadora DCF (600008SS)! Equipado com dados reais da Pequim Capital Eco-Aambient Protection Group Co., Ltd. e suposições personalizáveis, essa ferramenta permite prever, analisar e valorizar (600008Ss) como um investidor experiente.
Discounted Cash Flow (DCF) - (USD MM)
| Year | AY1 2020 |
AY2 2021 |
AY3 2022 |
AY4 2023 |
AY5 2024 |
FY1 2025 |
FY2 2026 |
FY3 2027 |
FY4 2028 |
FY5 2029 |
|---|---|---|---|---|---|---|---|---|---|---|
| Revenue | 19,224.6 | 22,812.9 | 22,164.2 | 21,332.1 | 20,050.0 | 20,353.6 | 20,661.8 | 20,974.7 | 21,292.3 | 21,614.7 |
| Revenue Growth, % | 0 | 18.66 | -2.84 | -3.75 | -6.01 | 1.51 | 1.51 | 1.51 | 1.51 | 1.51 |
| EBITDA | 5,759.8 | 7,207.4 | 7,124.4 | 7,545.9 | 7,808.3 | 6,839.4 | 6,943.0 | 7,048.1 | 7,154.9 | 7,263.2 |
| EBITDA, % | 29.96 | 31.59 | 32.14 | 35.37 | 38.94 | 33.6 | 33.6 | 33.6 | 33.6 | 33.6 |
| Depreciation | 2,277.7 | 2,744.0 | 2,733.3 | 3,165.0 | 3,214.5 | 2,730.5 | 2,771.9 | 2,813.9 | 2,856.5 | 2,899.7 |
| Depreciation, % | 11.85 | 12.03 | 12.33 | 14.84 | 16.03 | 13.42 | 13.42 | 13.42 | 13.42 | 13.42 |
| EBIT | 3,482.1 | 4,463.4 | 4,391.1 | 4,380.9 | 4,593.8 | 4,108.9 | 4,171.1 | 4,234.3 | 4,298.4 | 4,363.5 |
| EBIT, % | 18.11 | 19.57 | 19.81 | 20.54 | 22.91 | 20.19 | 20.19 | 20.19 | 20.19 | 20.19 |
| Total Cash | 8,919.4 | 8,236.6 | 6,079.9 | 5,336.3 | 6,417.3 | 6,796.2 | 6,899.1 | 7,003.6 | 7,109.7 | 7,217.3 |
| Total Cash, percent | .0 | .0 | .0 | .0 | .0 | .0 | .0 | .0 | .0 | .0 |
| Account Receivables | 5,362.1 | 9,688.7 | 14,241.8 | 16,625.4 | 21,811.6 | 12,723.2 | 12,915.9 | 13,111.4 | 13,310.0 | 13,511.5 |
| Account Receivables, % | 27.89 | 42.47 | 64.26 | 77.94 | 108.79 | 62.51 | 62.51 | 62.51 | 62.51 | 62.51 |
| Inventories | 1,169.6 | 1,220.3 | 1,351.1 | 1,280.2 | 1,043.9 | 1,169.8 | 1,187.5 | 1,205.5 | 1,223.7 | 1,242.2 |
| Inventories, % | 6.08 | 5.35 | 6.1 | 6 | 5.21 | 5.75 | 5.75 | 5.75 | 5.75 | 5.75 |
| Accounts Payable | 10,862.3 | 12,098.5 | 12,522.2 | 12,208.5 | 11,340.8 | 11,390.9 | 11,563.4 | 11,738.5 | 11,916.3 | 12,096.7 |
| Accounts Payable, % | 56.5 | 53.03 | 56.5 | 57.23 | 56.56 | 55.97 | 55.97 | 55.97 | 55.97 | 55.97 |
| Capital Expenditure | -12,417.0 | -8,927.2 | -5,875.6 | -4,467.0 | -4,169.9 | -7,000.3 | -7,106.3 | -7,213.9 | -7,323.2 | -7,434.1 |
| Capital Expenditure, % | -64.59 | -39.13 | -26.51 | -20.94 | -20.8 | -34.39 | -34.39 | -34.39 | -34.39 | -34.39 |
| Tax Rate, % | 27.74 | 27.74 | 27.74 | 27.74 | 27.74 | 27.74 | 27.74 | 27.74 | 27.74 | 27.74 |
| EBITAT | 2,285.4 | 3,118.0 | 2,821.5 | 2,637.7 | 3,319.5 | 2,730.1 | 2,771.4 | 2,813.4 | 2,856.0 | 2,899.3 |
| Depreciation | ||||||||||
| Changes in Account Receivables | ||||||||||
| Changes in Inventories | ||||||||||
| Changes in Accounts Payable | ||||||||||
| Capital Expenditure | ||||||||||
| UFCF | -3,523.2 | -6,206.2 | -4,580.9 | -1,290.7 | -3,453.5 | 7,473.0 | -1,600.9 | -1,625.1 | -1,649.8 | -1,674.7 |
| WACC, % | 3.35 | 3.46 | 3.31 | 3.21 | 3.52 | 3.37 | 3.37 | 3.37 | 3.37 | 3.37 |
| PV UFCF | ||||||||||
| SUM PV UFCF | 1,396.0 | |||||||||
| Long Term Growth Rate, % | 0.50 | |||||||||
| Free cash flow (T + 1) | -1,683 | |||||||||
| Terminal Value | -58,638 | |||||||||
| Present Terminal Value | -49,682 | |||||||||
| Enterprise Value | -48,286 | |||||||||
| Net Debt | 35,577 | |||||||||
| Equity Value | -83,863 | |||||||||
| Diluted Shares Outstanding, MM | 7,341 | |||||||||
| Equity Value Per Share | -11.42 |
What You Will Receive
- Authentic Financial Data: Comprehensive financials – encompassing revenue to EBIT – derived from actual and projected metrics for Beijing Capital Eco-environment Protection Group Co., Ltd. (600008SS).
- Complete Customization: Modify all key parameters (yellow cells) such as WACC, growth %, and tax rates to fit your analysis.
- Real-Time Valuation Updates: Automated recalculations to assess the effects of changes on the fair value of Beijing Capital Eco-environment Protection Group Co., Ltd. (600008SS).
- Flexible Excel Template: Designed for swift modifications, scenario analysis, and in-depth forecasting.
- Efficient and Accurate: Avoid starting from scratch in model building while ensuring accuracy and adaptability.
Key Features
- Authentic Financial Data: Obtain reliable historical figures and future estimates specifically for Beijing Capital Eco-environment Protection Group Co., Ltd. (600008SS).
- Adjustable Forecast Parameters: Modify the highlighted fields such as WACC, growth rates, and profit margins to fit your analysis.
- Real-Time Calculations: Automatic updates for DCF, Net Present Value (NPV), and cash flow evaluations.
- User-Friendly Dashboard: Clear and concise visual representations of your valuation outcomes.
- Designed for All Skill Levels: An intuitive layout suitable for investors, CFOs, and consultants, whether seasoned or new.
How It Functions
- Download the Template: Gain immediate access to the Excel-based Beijing Capital Eco-environment Protection Group DCF Calculator.
- Input Your Assumptions: Modify the yellow-highlighted cells to reflect growth rates, WACC, margins, and other variables.
- Instant Calculations: The model will automatically refresh to display the intrinsic value of Beijing Capital Eco-environment Protection Group (600008SS).
- Test Scenarios: Experiment with different assumptions to assess potential changes in valuation.
- Analyze and Decide: Utilize the results to inform your investment decisions or financial analyses.
Why Opt for This Calculator?
- Precise Data: Utilize authentic financials from Beijing Capital Eco-environment Protection Group Co., Ltd. to ensure trustworthy valuation outcomes.
- Tailorable Features: Modify essential parameters such as growth rates, WACC, and tax rates to fit your forecasts.
- Efficient: Built-in calculations save you the hassle of starting from the ground up.
- Professional-Quality Tool: Crafted for investors, analysts, and consultants in the eco-environment sector.
- Easy to Use: User-friendly design and straightforward instructions cater to users of all expertise levels.
Who Can Benefit from This Product?
- Investors: Evaluate the valuation of Beijing Capital Eco-environment Protection Group Co., Ltd. (600008SS) to inform stock trading decisions.
- CFOs and Financial Analysts: Enhance valuation processes and assess financial forecasts for eco-environmental firms.
- Startup Founders: Gain insights into how leading environmental companies like Beijing Capital are valued in the market.
- Consultants: Produce detailed valuation reports for clients in the eco-environment sector.
- Students and Educators: Utilize real-world examples from (600008SS) to practice and instruct on valuation methodologies.
Contents of the Template
- Operating and Balance Sheet Data: Pre-filled historical data and forecasts for Beijing Capital Eco-environment Protection Group Co., Ltd. (600008SS), including revenue, EBITDA, EBIT, and capital expenditures.
- WACC Calculation: A dedicated sheet for Weighted Average Cost of Capital (WACC), incorporating key parameters such as Beta, risk-free rate, and share price.
- DCF Valuation (Unlevered and Levered): Customizable Discounted Cash Flow models that display intrinsic value along with comprehensive calculations.
- Financial Statements: Pre-loaded annual and quarterly financial statements to facilitate thorough analysis.
- Key Ratios: Contains profitability, leverage, and efficiency ratios relevant to Beijing Capital Eco-environment Protection Group Co., Ltd. (600008SS).
- Dashboard and Charts: A visual overview of valuation outputs and assumptions for easy result analysis.
Disclaimer
All information, articles, and product details provided on this website are for general informational and educational purposes only. We do not claim any ownership over, nor do we intend to infringe upon, any trademarks, copyrights, logos, brand names, or other intellectual property mentioned or depicted on this site. Such intellectual property remains the property of its respective owners, and any references here are made solely for identification or informational purposes, without implying any affiliation, endorsement, or partnership.
We make no representations or warranties, express or implied, regarding the accuracy, completeness, or suitability of any content or products presented. Nothing on this website should be construed as legal, tax, investment, financial, medical, or other professional advice. In addition, no part of this site—including articles or product references—constitutes a solicitation, recommendation, endorsement, advertisement, or offer to buy or sell any securities, franchises, or other financial instruments, particularly in jurisdictions where such activity would be unlawful.
All content is of a general nature and may not address the specific circumstances of any individual or entity. It is not a substitute for professional advice or services. Any actions you take based on the information provided here are strictly at your own risk. You accept full responsibility for any decisions or outcomes arising from your use of this website and agree to release us from any liability in connection with your use of, or reliance upon, the content or products found herein.