
|
Zhejiang Zheneng Electric Power Co., Ltd. (600023.Ss) DCF Avaliação |
Totalmente Editável: Adapte-Se Às Suas Necessidades No Excel Ou Planilhas
Design Profissional: Modelos Confiáveis E Padrão Da Indústria
Pré-Construídos Para Uso Rápido E Eficiente
Compatível com MAC/PC, totalmente desbloqueado
Não É Necessária Experiência; Fácil De Seguir
Zhejiang Zheneng Electric Power Co., Ltd. (600023.SS) Bundle
Avalie as perspectivas financeiras da Zhejiang Zheneng Electric Power Co., Ltd. (600023Ss) com precisão especializada! Esta calculadora (600023Ss) DCF fornece dados financeiros pré-preenchidos, juntamente com a flexibilidade para modificar o crescimento da receita, o WACC, as margens de lucro e outras suposições essenciais para se alinhar às suas projeções.
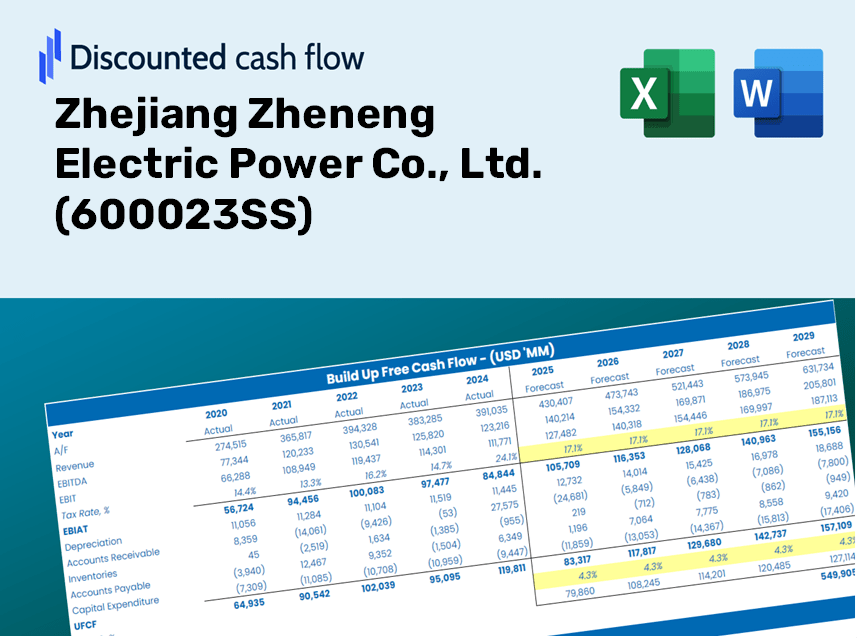
Discounted Cash Flow (DCF) - (USD MM)
| Year | AY1 2020 |
AY2 2021 |
AY3 2022 |
AY4 2023 |
AY5 2024 |
FY1 2025 |
FY2 2026 |
FY3 2027 |
FY4 2028 |
FY5 2029 |
|---|---|---|---|---|---|---|---|---|---|---|
| Revenue | 51,684.4 | 71,075.7 | 80,194.6 | 95,975.2 | 88,003.0 | 101,581.9 | 117,255.9 | 135,348.5 | 156,232.7 | 180,339.3 |
| Revenue Growth, % | 0 | 37.52 | 12.83 | 19.68 | -8.31 | 15.43 | 15.43 | 15.43 | 15.43 | 15.43 |
| EBITDA | 10,985.2 | 1,780.8 | 103.4 | 11,579.1 | 13,371.9 | 10,391.5 | 11,994.9 | 13,845.7 | 15,982.0 | 18,448.1 |
| EBITDA, % | 21.25 | 2.51 | 0.12894 | 12.06 | 15.19 | 10.23 | 10.23 | 10.23 | 10.23 | 10.23 |
| Depreciation | 5,630.2 | 5,708.8 | 5,675.9 | 6,083.8 | 6,311.5 | 8,027.8 | 9,266.5 | 10,696.3 | 12,346.7 | 14,251.8 |
| Depreciation, % | 10.89 | 8.03 | 7.08 | 6.34 | 7.17 | 7.9 | 7.9 | 7.9 | 7.9 | 7.9 |
| EBIT | 5,355.1 | -3,928.0 | -5,572.5 | 5,495.2 | 7,060.3 | 2,363.7 | 2,728.4 | 3,149.4 | 3,635.3 | 4,196.2 |
| EBIT, % | 10.36 | -5.53 | -6.95 | 5.73 | 8.02 | 2.33 | 2.33 | 2.33 | 2.33 | 2.33 |
| Total Cash | 18,567.0 | 11,148.4 | 13,123.1 | 19,363.7 | 16,363.5 | 21,686.4 | 25,032.5 | 28,895.1 | 33,353.6 | 38,500.0 |
| Total Cash, percent | .0 | .0 | .0 | .0 | .0 | .0 | .0 | .0 | .0 | .0 |
| Account Receivables | 7,108.7 | 9,785.7 | 9,362.8 | 14,704.0 | 13,683.6 | 14,235.0 | 16,431.5 | 18,966.9 | 21,893.5 | 25,271.6 |
| Account Receivables, % | 13.75 | 13.77 | 11.68 | 15.32 | 15.55 | 14.01 | 14.01 | 14.01 | 14.01 | 14.01 |
| Inventories | 2,734.0 | 4,329.4 | 5,536.3 | 6,537.6 | 5,885.4 | 6,457.4 | 7,453.8 | 8,603.9 | 9,931.5 | 11,463.9 |
| Inventories, % | 5.29 | 6.09 | 6.9 | 6.81 | 6.69 | 6.36 | 6.36 | 6.36 | 6.36 | 6.36 |
| Accounts Payable | 5,859.8 | 5,181.3 | 7,582.6 | 11,151.6 | 13,259.6 | 11,127.1 | 12,844.0 | 14,825.8 | 17,113.5 | 19,754.1 |
| Accounts Payable, % | 11.34 | 7.29 | 9.46 | 11.62 | 15.07 | 10.95 | 10.95 | 10.95 | 10.95 | 10.95 |
| Capital Expenditure | -3,202.3 | -4,711.6 | -5,636.6 | -9,029.9 | -9,679.9 | -8,179.7 | -9,441.8 | -10,898.7 | -12,580.4 | -14,521.5 |
| Capital Expenditure, % | -6.2 | -6.63 | -7.03 | -9.41 | -11 | -8.05 | -8.05 | -8.05 | -8.05 | -8.05 |
| Tax Rate, % | 22.71 | 22.71 | 22.71 | 22.71 | 22.71 | 22.71 | 22.71 | 22.71 | 22.71 | 22.71 |
| EBITAT | 4,167.5 | -1,173.2 | -3,286.1 | 3,934.2 | 5,456.6 | 1,491.7 | 1,721.8 | 1,987.5 | 2,294.2 | 2,648.2 |
| Depreciation | ||||||||||
| Changes in Account Receivables | ||||||||||
| Changes in Inventories | ||||||||||
| Changes in Accounts Payable | ||||||||||
| Capital Expenditure | ||||||||||
| UFCF | 2,612.4 | -5,126.8 | -1,629.6 | -1,785.3 | 5,868.9 | -1,916.3 | 70.5 | 81.4 | 94.0 | 108.5 |
| WACC, % | 3.89 | 3.26 | 3.64 | 3.81 | 3.89 | 3.7 | 3.7 | 3.7 | 3.7 | 3.7 |
| PV UFCF | ||||||||||
| SUM PV UFCF | -1,537.6 | |||||||||
| Long Term Growth Rate, % | 2.00 | |||||||||
| Free cash flow (T + 1) | 111 | |||||||||
| Terminal Value | 6,512 | |||||||||
| Present Terminal Value | 5,431 | |||||||||
| Enterprise Value | 3,893 | |||||||||
| Net Debt | 24,117 | |||||||||
| Equity Value | -20,224 | |||||||||
| Diluted Shares Outstanding, MM | 13,368 | |||||||||
| Equity Value Per Share | -1.51 |
What You'll Receive
- Customizable Excel Template: An editable DCF Calculator in Excel format featuring pre-filled financial data for Zhejiang Zheneng Electric Power Co., Ltd. (600023SS).
- Actual Financial Data: Access to historical performance metrics and future projections (highlighted in the yellow cells).
- Flexible Forecasting: Adjust key assumptions such as revenue growth, EBITDA margin, and WACC.
- Instantaneous Calculations: Quickly visualize how your inputs affect the valuation of Zhejiang Zheneng Electric Power Co., Ltd. (600023SS).
- Professional-Grade Tool: Designed for use by investors, CFOs, consultants, and financial analysts.
- Intuitive Layout: Clear and straightforward design with step-by-step guidance for ease of navigation.
Key Features
- Comprehensive DCF Calculator: Features detailed unlevered and levered DCF valuation models tailored for Zhejiang Zheneng Electric Power Co., Ltd. (600023SS).
- WACC Calculator: Equipped with a pre-designed Weighted Average Cost of Capital sheet that allows for customizable inputs.
- Adjustable Forecast Assumptions: Easily modify growth rates, capital expenditures, and discount rates to fit your analysis needs.
- Integrated Financial Ratios: Examine key profitability, leverage, and efficiency ratios specific to Zhejiang Zheneng Electric Power Co., Ltd. (600023SS).
- Interactive Dashboard and Charts: Visual presentations that encapsulate essential valuation metrics for streamlined analysis.
How It Works
- Step 1: Download the prebuilt Excel template that contains data for Zhejiang Zheneng Electric Power Co., Ltd. (600023SS).
- Step 2: Review the pre-filled sheets to familiarize yourself with the essential metrics.
- Step 3: Modify forecasts and assumptions in the editable yellow cells (WACC, growth, margins).
- Step 4: Instantly see updated results, including the intrinsic value of Zhejiang Zheneng Electric Power Co., Ltd. (600023SS).
- Step 5: Use the output to make well-informed investment decisions or create detailed reports.
Why Choose Our Calculator for Zhejiang Zheneng Electric Power Co., Ltd. (600023SS)?
- All-in-One Solution: Features DCF, WACC, and financial ratio analyses seamlessly integrated.
- Flexible Inputs: Modify the yellow-highlighted cells to explore different investment scenarios.
- In-Depth Analysis: Automatically computes the intrinsic value and Net Present Value for Zhejiang Zheneng Electric Power Co., Ltd.
- Preloaded Information: Access to historical and projected data for reliable analysis.
- High-Caliber Features: Perfect for financial analysts, investors, and business advisors.
Who Can Benefit from This Product?
- Finance Students: Master valuation techniques and apply them with actual data on Zhejiang Zheneng Electric Power Co., Ltd. (600023SS).
- Academics: Enhance your coursework or research by integrating industry-standard models.
- Investors: Validate your assumptions and explore valuation metrics for Zhejiang Zheneng Electric Power Co., Ltd. (600023SS).
- Analysts: Optimize your analysis with a ready-to-use, customizable DCF model tailored for Zhejiang Zheneng Electric Power Co., Ltd. (600023SS).
- Small Business Owners: Understand the evaluation methods used for leading public companies like Zhejiang Zheneng Electric Power Co., Ltd. (600023SS).
What the Template Contains
- Preloaded Zheneng Data: Historical and projected financial data, including revenue, EBIT, and capital expenditures for Zhejiang Zheneng Electric Power Co., Ltd. (600023SS).
- DCF and WACC Models: Professional-grade spreadsheets for calculating intrinsic value and Weighted Average Cost of Capital tailored for Zheneng.
- Editable Inputs: Yellow-highlighted cells for customizing revenue growth, tax rates, and discount rates specific to (600023SS).
- Financial Statements: Detailed annual and quarterly financial reports for comprehensive analysis of Zhejiang Zheneng Electric Power Co., Ltd. (600023SS).
- Key Ratios: Metrics for profitability, leverage, and efficiency to assess performance accurately.
- Dashboard and Charts: Visual representations of valuation results and underlying assumptions for (600023SS).
Disclaimer
All information, articles, and product details provided on this website are for general informational and educational purposes only. We do not claim any ownership over, nor do we intend to infringe upon, any trademarks, copyrights, logos, brand names, or other intellectual property mentioned or depicted on this site. Such intellectual property remains the property of its respective owners, and any references here are made solely for identification or informational purposes, without implying any affiliation, endorsement, or partnership.
We make no representations or warranties, express or implied, regarding the accuracy, completeness, or suitability of any content or products presented. Nothing on this website should be construed as legal, tax, investment, financial, medical, or other professional advice. In addition, no part of this site—including articles or product references—constitutes a solicitation, recommendation, endorsement, advertisement, or offer to buy or sell any securities, franchises, or other financial instruments, particularly in jurisdictions where such activity would be unlawful.
All content is of a general nature and may not address the specific circumstances of any individual or entity. It is not a substitute for professional advice or services. Any actions you take based on the information provided here are strictly at your own risk. You accept full responsibility for any decisions or outcomes arising from your use of this website and agree to release us from any liability in connection with your use of, or reliance upon, the content or products found herein.