
|
Hubei Chutian Smart Communication Co., Ltd. (600035.Ss) Avaliação do DCF |
Totalmente Editável: Adapte-Se Às Suas Necessidades No Excel Ou Planilhas
Design Profissional: Modelos Confiáveis E Padrão Da Indústria
Pré-Construídos Para Uso Rápido E Eficiente
Compatível com MAC/PC, totalmente desbloqueado
Não É Necessária Experiência; Fácil De Seguir
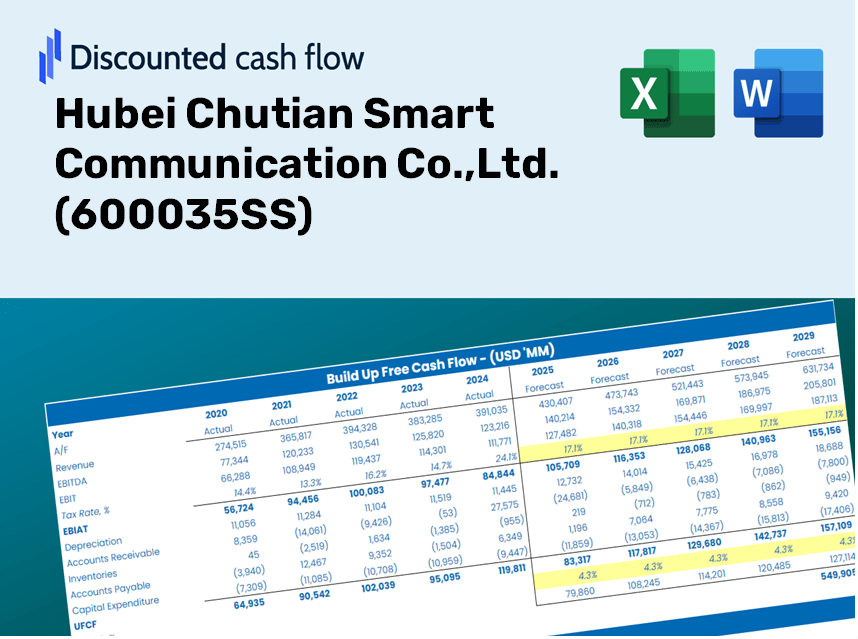
Hubei Chutian Smart Communication Co.,Ltd. (600035.SS) Bundle
Aprimore suas estratégias de investimento com a calculadora DCF (600035SS)! Obtenha dados financeiros reais da Hubei Chutian Smart Communication Co., Ltd., ajuste as previsões e despesas do crescimento e observe os efeitos imediatos no valor intrínseco de (600035Ss).
Discounted Cash Flow (DCF) - (USD MM)
| Year | AY1 2020 |
AY2 2021 |
AY3 2022 |
AY4 2023 |
AY5 2024 |
FY1 2025 |
FY2 2026 |
FY3 2027 |
FY4 2028 |
FY5 2029 |
|---|---|---|---|---|---|---|---|---|---|---|
| Revenue | 2,486.7 | 3,264.0 | 2,917.2 | 3,196.2 | 4,387.3 | 5,127.3 | 5,992.1 | 7,002.7 | 8,183.8 | 9,564.0 |
| Revenue Growth, % | 0 | 31.26 | -10.63 | 9.57 | 37.27 | 16.87 | 16.87 | 16.87 | 16.87 | 16.87 |
| EBITDA | 1,257.8 | 1,972.5 | 1,986.3 | 2,292.4 | 2,163.6 | 3,077.8 | 3,596.9 | 4,203.6 | 4,912.5 | 5,741.1 |
| EBITDA, % | 50.58 | 60.43 | 68.09 | 71.72 | 49.31 | 60.03 | 60.03 | 60.03 | 60.03 | 60.03 |
| Depreciation | 449.0 | 558.7 | 639.9 | 743.8 | 829.5 | 1,018.1 | 1,189.8 | 1,390.5 | 1,625.0 | 1,899.1 |
| Depreciation, % | 18.05 | 17.12 | 21.94 | 23.27 | 18.91 | 19.86 | 19.86 | 19.86 | 19.86 | 19.86 |
| EBIT | 808.8 | 1,413.9 | 1,346.4 | 1,548.6 | 1,334.1 | 2,059.7 | 2,407.1 | 2,813.1 | 3,287.5 | 3,842.0 |
| EBIT, % | 32.53 | 43.32 | 46.15 | 48.45 | 30.41 | 40.17 | 40.17 | 40.17 | 40.17 | 40.17 |
| Total Cash | 721.5 | 842.6 | 1,886.8 | 1,631.3 | 951.1 | 1,971.2 | 2,303.7 | 2,692.2 | 3,146.3 | 3,676.9 |
| Total Cash, percent | .0 | .0 | .0 | .0 | .0 | .0 | .0 | .0 | .0 | .0 |
| Account Receivables | 511.3 | 476.1 | 386.8 | 278.6 | 429.0 | 686.1 | 801.8 | 937.0 | 1,095.1 | 1,279.8 |
| Account Receivables, % | 20.56 | 14.59 | 13.26 | 8.72 | 9.78 | 13.38 | 13.38 | 13.38 | 13.38 | 13.38 |
| Inventories | 210.4 | 134.4 | 47.2 | 65.3 | 47.7 | 177.7 | 207.6 | 242.6 | 283.6 | 331.4 |
| Inventories, % | 8.46 | 4.12 | 1.62 | 2.04 | 1.09 | 3.46 | 3.46 | 3.46 | 3.46 | 3.46 |
| Accounts Payable | 548.1 | 533.7 | 492.3 | 208.4 | 508.6 | 752.5 | 879.4 | 1,027.7 | 1,201.1 | 1,403.7 |
| Accounts Payable, % | 22.04 | 16.35 | 16.88 | 6.52 | 11.59 | 14.68 | 14.68 | 14.68 | 14.68 | 14.68 |
| Capital Expenditure | -119.3 | -62.9 | -186.1 | -1,436.6 | -938.2 | -814.6 | -952.0 | -1,112.5 | -1,300.2 | -1,519.5 |
| Capital Expenditure, % | -4.8 | -1.93 | -6.38 | -44.95 | -21.39 | -15.89 | -15.89 | -15.89 | -15.89 | -15.89 |
| Tax Rate, % | 29.62 | 29.62 | 29.62 | 29.62 | 29.62 | 29.62 | 29.62 | 29.62 | 29.62 | 29.62 |
| EBITAT | 540.1 | 934.2 | 952.5 | 1,144.9 | 938.9 | 1,433.1 | 1,674.9 | 1,957.3 | 2,287.5 | 2,673.3 |
| Depreciation | ||||||||||
| Changes in Account Receivables | ||||||||||
| Changes in Inventories | ||||||||||
| Changes in Accounts Payable | ||||||||||
| Capital Expenditure | ||||||||||
| UFCF | 696.1 | 1,526.7 | 1,541.6 | 258.2 | 997.5 | 1,493.5 | 1,893.9 | 2,213.4 | 2,586.7 | 3,023.0 |
| WACC, % | 3.61 | 3.59 | 3.68 | 3.74 | 3.67 | 3.66 | 3.66 | 3.66 | 3.66 | 3.66 |
| PV UFCF | ||||||||||
| SUM PV UFCF | 9,956.7 | |||||||||
| Long Term Growth Rate, % | 0.50 | |||||||||
| Free cash flow (T + 1) | 3,038 | |||||||||
| Terminal Value | 96,168 | |||||||||
| Present Terminal Value | 80,351 | |||||||||
| Enterprise Value | 90,308 | |||||||||
| Net Debt | 5,598 | |||||||||
| Equity Value | 84,711 | |||||||||
| Diluted Shares Outstanding, MM | 1,610 | |||||||||
| Equity Value Per Share | 52.61 |
What You'll Receive
- Comprehensive Financial Model: Leverage Hubei Chutian Smart Communication's actual data for accurate DCF valuation.
- Complete Forecast Flexibility: Modify revenue growth, profit margins, WACC, and other essential parameters.
- Real-Time Calculations: Immediate updates provide instant insights as you adjust inputs.
- Professional-Grade Template: A polished Excel file crafted for expert-level valuation.
- Custom Tailored and Reusable: Designed for adaptability, allowing multiple uses for in-depth forecasting.
Essential Features
- Customizable Financial Parameters: Adjust key inputs such as revenue growth, operating margin, and capital investments.
- Instant DCF Valuation: Quickly calculates intrinsic value, NPV, and other critical metrics.
- High-Precision Accuracy: Relies on Hubei Chutian Smart Communication Co., Ltd.'s (600035SS) actual financial data for precise valuation results.
- Effortless Scenario Analysis: Easily explore various assumptions and compare their impacts on outcomes.
- Efficiency Booster: Streamline your workflow by avoiding the complexity of building valuation models from the ground up.
How It Operates
- Step 1: Download the Excel spreadsheet.
- Step 2: Review the pre-filled data for Hubei Chutian Smart Communication Co., Ltd. (600035SS) (historical and projected).
- Step 3: Modify key assumptions (highlighted cells) based on your analysis.
- Step 4: Observe the automatic recalculations of Hubei Chutian Smart Communication Co., Ltd.'s intrinsic value.
- Step 5: Utilize the results for investment decisions or reporting purposes.
Why Choose This Calculator for Hubei Chutian Smart Communication Co., Ltd. (600035SS)?
- Designed for Industry Experts: A sophisticated tool favored by analysts, CFOs, and consultants.
- Accurate Data: Historical and projected financial information for Hubei Chutian preloaded for reliability.
- Comprehensive Scenario Analysis: Effortlessly model various forecasts and assumptions.
- Insightful Outputs: Automatically generates intrinsic value, NPV, and essential performance metrics.
- User-Friendly: Detailed step-by-step guidance makes the process simple.
Who Should Utilize This Product?
- Investors: Accurately assess Hubei Chutian Smart Communication Co., Ltd.'s fair value before making investment choices.
- CFOs: Utilize a professional-grade DCF model for precise financial reporting and analysis.
- Consultants: Easily customize the template for client valuation reports.
- Entrepreneurs: Obtain valuable insights into financial modeling practices employed by leading companies.
- Educators: Apply it as a teaching resource to illustrate various valuation methodologies.
Overview of Template Features
- Preloaded Hubei Chutian Smart Communication Data: Historical and forecasted financial metrics, including revenue, EBIT, and capital expenditures.
- DCF and WACC Models: Advanced financial worksheets for calculating intrinsic value and Weighted Average Cost of Capital.
- Customizable Inputs: Yellow-highlighted fields for modifying revenue growth, tax rates, and discount rates.
- Financial Statements: Detailed annual and quarterly financial reports for thorough analysis.
- Key Ratios: Metrics for profitability, leverage, and efficiency to assess performance.
- Dashboard and Charts: Visual representation of valuation results and underlying assumptions.
Disclaimer
All information, articles, and product details provided on this website are for general informational and educational purposes only. We do not claim any ownership over, nor do we intend to infringe upon, any trademarks, copyrights, logos, brand names, or other intellectual property mentioned or depicted on this site. Such intellectual property remains the property of its respective owners, and any references here are made solely for identification or informational purposes, without implying any affiliation, endorsement, or partnership.
We make no representations or warranties, express or implied, regarding the accuracy, completeness, or suitability of any content or products presented. Nothing on this website should be construed as legal, tax, investment, financial, medical, or other professional advice. In addition, no part of this site—including articles or product references—constitutes a solicitation, recommendation, endorsement, advertisement, or offer to buy or sell any securities, franchises, or other financial instruments, particularly in jurisdictions where such activity would be unlawful.
All content is of a general nature and may not address the specific circumstances of any individual or entity. It is not a substitute for professional advice or services. Any actions you take based on the information provided here are strictly at your own risk. You accept full responsibility for any decisions or outcomes arising from your use of this website and agree to release us from any liability in connection with your use of, or reliance upon, the content or products found herein.