
|
Pequim Tongrentang Co., Ltd (600085.Ss) Avaliação DCF |
Totalmente Editável: Adapte-Se Às Suas Necessidades No Excel Ou Planilhas
Design Profissional: Modelos Confiáveis E Padrão Da Indústria
Pré-Construídos Para Uso Rápido E Eficiente
Compatível com MAC/PC, totalmente desbloqueado
Não É Necessária Experiência; Fácil De Seguir
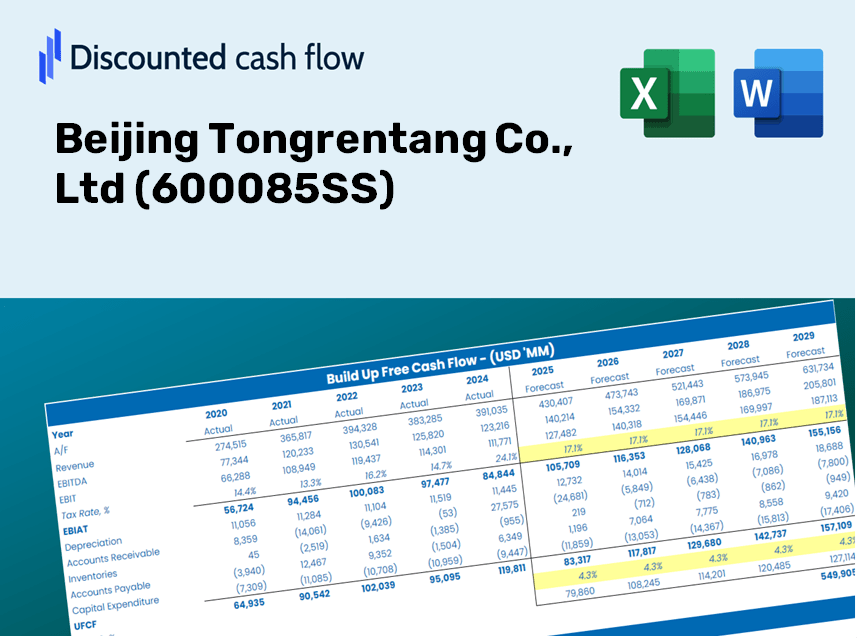
Beijing Tongrentang Co., Ltd (600085.SS) Bundle
Avalie as perspectivas financeiras da Pequim Tongrentang Co., Ltd como um especialista! Esta calculadora (600085Ss) DCF fornece dados financeiros pré-preenchidos e flexibilidade total para modificar o crescimento da receita, o WACC, as margens e outras suposições essenciais para se alinhar às suas previsões.
Discounted Cash Flow (DCF) - (USD MM)
| Year | AY1 2020 |
AY2 2021 |
AY3 2022 |
AY4 2023 |
AY5 2024 |
FY1 2025 |
FY2 2026 |
FY3 2027 |
FY4 2028 |
FY5 2029 |
|---|---|---|---|---|---|---|---|---|---|---|
| Revenue | 12,825.9 | 14,603.1 | 15,372.4 | 17,860.9 | 18,597.3 | 20,430.8 | 22,445.0 | 24,657.8 | 27,088.8 | 29,759.5 |
| Revenue Growth, % | 0 | 13.86 | 5.27 | 16.19 | 4.12 | 9.86 | 9.86 | 9.86 | 9.86 | 9.86 |
| EBITDA | 2,250.7 | 2,646.5 | 2,965.4 | 3,299.9 | 3,047.4 | 3,670.3 | 4,032.2 | 4,429.7 | 4,866.4 | 5,346.2 |
| EBITDA, % | 17.55 | 18.12 | 19.29 | 18.48 | 16.39 | 17.96 | 17.96 | 17.96 | 17.96 | 17.96 |
| Depreciation | 342.9 | 321.2 | 335.6 | 350.5 | 347.6 | 444.9 | 488.7 | 536.9 | 589.8 | 648.0 |
| Depreciation, % | 2.67 | 2.2 | 2.18 | 1.96 | 1.87 | 2.18 | 2.18 | 2.18 | 2.18 | 2.18 |
| EBIT | 1,907.8 | 2,325.4 | 2,629.9 | 2,949.4 | 2,699.9 | 3,225.5 | 3,543.5 | 3,892.8 | 4,276.6 | 4,698.2 |
| EBIT, % | 14.87 | 15.92 | 17.11 | 16.51 | 14.52 | 15.79 | 15.79 | 15.79 | 15.79 | 15.79 |
| Total Cash | 8,351.0 | 9,926.3 | 11,624.4 | 12,132.3 | 10,756.7 | 13,666.9 | 15,014.3 | 16,494.6 | 18,120.8 | 19,907.3 |
| Total Cash, percent | .0 | .0 | .0 | .0 | .0 | .0 | .0 | .0 | .0 | .0 |
| Account Receivables | 1,606.4 | 1,686.0 | 1,882.1 | 1,374.2 | 1,768.5 | 2,186.8 | 2,402.4 | 2,639.2 | 2,899.4 | 3,185.3 |
| Account Receivables, % | 12.52 | 11.55 | 12.24 | 7.69 | 9.51 | 10.7 | 10.7 | 10.7 | 10.7 | 10.7 |
| Inventories | 6,060.6 | 6,169.1 | 6,694.4 | 9,340.2 | 10,729.9 | 9,930.8 | 10,909.9 | 11,985.5 | 13,167.1 | 14,465.2 |
| Inventories, % | 47.25 | 42.25 | 43.55 | 52.29 | 57.7 | 48.61 | 48.61 | 48.61 | 48.61 | 48.61 |
| Accounts Payable | 2,864.6 | 3,230.6 | 3,491.2 | 4,501.6 | 4,115.8 | 4,678.8 | 5,140.0 | 5,646.8 | 6,203.5 | 6,815.1 |
| Accounts Payable, % | 22.33 | 22.12 | 22.71 | 25.2 | 22.13 | 22.9 | 22.9 | 22.9 | 22.9 | 22.9 |
| Capital Expenditure | -1,151.0 | -471.2 | -330.0 | -324.5 | -519.6 | -774.7 | -851.0 | -934.9 | -1,027.1 | -1,128.4 |
| Capital Expenditure, % | -8.97 | -3.23 | -2.15 | -1.82 | -2.79 | -3.79 | -3.79 | -3.79 | -3.79 | -3.79 |
| Tax Rate, % | 45.59 | 45.59 | 45.59 | 45.59 | 45.59 | 45.59 | 45.59 | 45.59 | 45.59 | 45.59 |
| EBITAT | 992.3 | 1,226.4 | 1,381.6 | 1,597.7 | 1,468.9 | 1,715.1 | 1,884.2 | 2,069.9 | 2,274.0 | 2,498.2 |
| Depreciation | ||||||||||
| Changes in Account Receivables | ||||||||||
| Changes in Inventories | ||||||||||
| Changes in Accounts Payable | ||||||||||
| Capital Expenditure | ||||||||||
| UFCF | -4,618.1 | 1,254.2 | 926.3 | 496.3 | -873.0 | 2,329.1 | 788.5 | 866.2 | 951.6 | 1,045.4 |
| WACC, % | 4.45 | 4.45 | 4.45 | 4.46 | 4.46 | 4.45 | 4.45 | 4.45 | 4.45 | 4.45 |
| PV UFCF | ||||||||||
| SUM PV UFCF | 5,352.8 | |||||||||
| Long Term Growth Rate, % | 3.00 | |||||||||
| Free cash flow (T + 1) | 1,077 | |||||||||
| Terminal Value | 74,115 | |||||||||
| Present Terminal Value | 59,608 | |||||||||
| Enterprise Value | 64,961 | |||||||||
| Net Debt | -8,065 | |||||||||
| Equity Value | 73,025 | |||||||||
| Diluted Shares Outstanding, MM | 1,371 | |||||||||
| Equity Value Per Share | 53.25 |
What You Will Receive
- Authentic Beijing Tongrentang Data: Comprehensive financials – including revenue and EBIT – derived from actual and forecasted figures.
- Complete Customization: Modify all essential parameters (highlighted in yellow) such as WACC, growth percentage, and tax rates.
- Immediate Valuation Adjustments: Automatic recalculations to assess the effect of changes on Beijing Tongrentang's fair value.
- Flexible Excel Template: Designed for quick modifications, scenario analysis, and in-depth projections.
- Efficient and Precise: Avoid the hassle of constructing models from the ground up while ensuring accuracy and adaptability.
Key Features
- Real-Life BTRT Data: Pre-filled with Beijing Tongrentang’s historical financials and future projections.
- Fully Customizable Inputs: Adjust revenue growth rates, profit margins, WACC, tax rates, and capital expenditures.
- Dynamic Valuation Model: Automatic updates to Net Present Value (NPV) and intrinsic value based on user inputs.
- Scenario Testing: Develop multiple forecasting scenarios to assess varying valuation outcomes.
- User-Friendly Design: Intuitive and structured, catering to both professionals and newcomers.
How It Operates
- Step 1: Download the Excel template.
- Step 2: Examine the pre-filled data for Beijing Tongrentang Co., Ltd (600085SS), including both historical and projected figures.
- Step 3: Modify the key assumptions (highlighted in yellow) according to your evaluations.
- Step 4: Observe the automatic updates that reflect the intrinsic value of Beijing Tongrentang Co., Ltd (600085SS).
- Step 5: Utilize the results for investment analysis or reporting purposes.
Why Opt for This Calculator?
- Designed for Experts: A sophisticated tool tailored for analysts, CFOs, and consultants.
- Real-Time Data: Beijing Tongrentang’s (600085SS) historical and projected financials are preloaded for precision.
- Flexible Scenario Analysis: Effortlessly test various forecasts and assumptions.
- Comprehensive Outputs: Automatically computes intrinsic value, NPV, and essential metrics.
- User-Friendly: Step-by-step guidance walks you through each stage of the process.
Who Should Utilize This Product?
- Professional Investors: Create comprehensive and accurate valuation models for assessing portfolios involving Beijing Tongrentang Co., Ltd (600085SS).
- Corporate Finance Teams: Evaluate valuation scenarios to inform strategic decisions within the organization.
- Consultants and Advisors: Equip clients with precise valuation insights regarding Beijing Tongrentang Co., Ltd (600085SS).
- Students and Educators: Access real-world data to enhance learning and practice in financial modeling disciplines.
- Market Enthusiasts: Gain insights into the valuation methodologies used for companies like Beijing Tongrentang Co., Ltd (600085SS).
Contents of the Template
- Pre-Filled Data: Contains Beijing Tongrentang Co., Ltd's historical financials and projections.
- Discounted Cash Flow Model: Editable DCF valuation model with automated calculations.
- Weighted Average Cost of Capital (WACC): A specialized sheet for WACC calculations based on user-defined inputs.
- Key Financial Ratios: Assess Beijing Tongrentang Co., Ltd's profitability, efficiency, and leverage.
- Customizable Inputs: Easily modify revenue growth, profit margins, and tax rates.
- Comprehensive Dashboard: Visual representations and tables summarizing essential valuation outcomes.
Disclaimer
All information, articles, and product details provided on this website are for general informational and educational purposes only. We do not claim any ownership over, nor do we intend to infringe upon, any trademarks, copyrights, logos, brand names, or other intellectual property mentioned or depicted on this site. Such intellectual property remains the property of its respective owners, and any references here are made solely for identification or informational purposes, without implying any affiliation, endorsement, or partnership.
We make no representations or warranties, express or implied, regarding the accuracy, completeness, or suitability of any content or products presented. Nothing on this website should be construed as legal, tax, investment, financial, medical, or other professional advice. In addition, no part of this site—including articles or product references—constitutes a solicitation, recommendation, endorsement, advertisement, or offer to buy or sell any securities, franchises, or other financial instruments, particularly in jurisdictions where such activity would be unlawful.
All content is of a general nature and may not address the specific circumstances of any individual or entity. It is not a substitute for professional advice or services. Any actions you take based on the information provided here are strictly at your own risk. You accept full responsibility for any decisions or outcomes arising from your use of this website and agree to release us from any liability in connection with your use of, or reliance upon, the content or products found herein.