
|
Gansu Yasheng Industrial Co., Ltd. (600108.SS) Avaliação DCF |
Totalmente Editável: Adapte-Se Às Suas Necessidades No Excel Ou Planilhas
Design Profissional: Modelos Confiáveis E Padrão Da Indústria
Pré-Construídos Para Uso Rápido E Eficiente
Compatível com MAC/PC, totalmente desbloqueado
Não É Necessária Experiência; Fácil De Seguir
Gansu Yasheng Industrial (Group) Co., Ltd. (600108.SS) Bundle
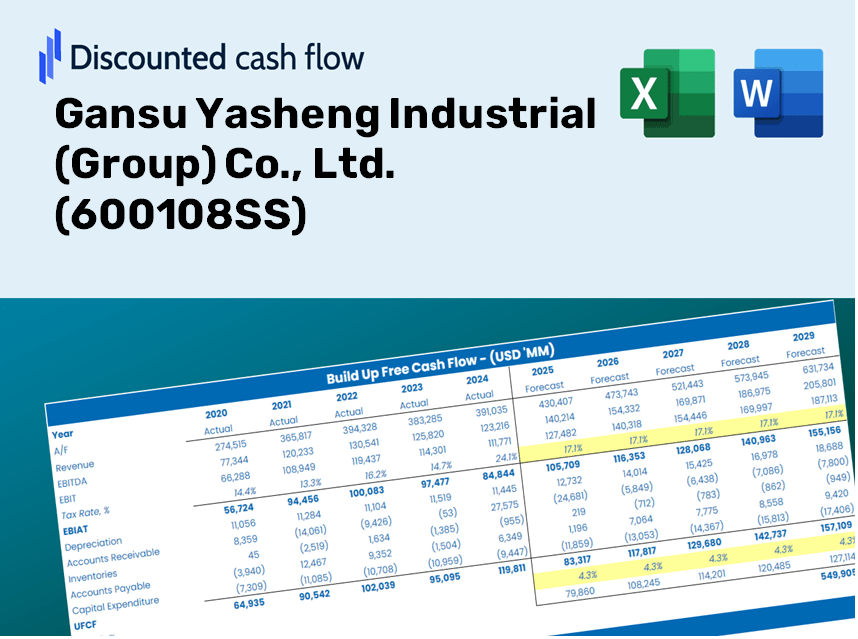
Avalie as perspectivas financeiras da Gansu Yasheng Industrial (Group) Co., Ltd. Como um especialista! Esta (600108SS) calculadora DCF fornece dados financeiros pré-preenchidos e oferece total flexibilidade para modificar o crescimento da receita, o WACC, as margens e outras suposições cruciais para se alinhar às suas projeções.
Benefits You Will Receive
- Comprehensive Financial Model: Utilize Gansu Yasheng Industrial’s actual data for accurate DCF valuation.
- Complete Forecast Flexibility: Adjust key metrics such as revenue growth, profit margins, WACC, and more.
- Real-Time Calculations: Enjoy automatic updates that reflect changes instantly.
- Professional-Grade Template: An advanced Excel workbook crafted for high-level valuation analysis.
- Adaptable and Reusable: Designed for versatility, facilitating repeated use for in-depth forecasting.
Key Features
- Real-Time Gansu Yasheng Data: Pre-filled with the company's historical financial data and future projections.
- Customizable Financial Inputs: Modify revenue growth rates, profit margins, discount rates, tax percentages, and capital investment figures.
- Dynamic Valuation Framework: Automatic recalculation of Net Present Value (NPV) and intrinsic value based on your customized inputs.
- Scenario Analysis Capability: Develop various forecasting scenarios to explore different valuation possibilities.
- Intuitive User Interface: A clear, organized design suitable for both seasoned professionals and newcomers.
How It Works
- Step 1: Download the Excel file for Gansu Yasheng Industrial (Group) Co., Ltd. (600108SS).
- Step 2: Examine the pre-filled financial data and forecasts for Gansu Yasheng.
- Step 3: Adjust key parameters such as revenue growth, WACC, and tax rates (highlighted cells).
- Step 4: Observe the DCF model refresh in real-time as you modify your assumptions.
- Step 5: Evaluate the outcomes and leverage the findings for your investment strategies.
Why Select the Gansu Yasheng Industrial (Group) Co., Ltd. Calculator?
- All-in-One Solution: Features DCF, WACC, and comprehensive financial ratio analyses integrated into a single tool.
- Flexible Inputs: Modify the yellow-highlighted fields to explore different financial scenarios.
- In-Depth Analysis: Automatically computes the intrinsic value and Net Present Value of Gansu Yasheng Industrial (Group) Co., Ltd. (600108SS).
- Pre-Loaded Information: Access to both historical and projected data provides a solid foundation for analysis.
- High-Quality Insights: Perfect for financial analysts, investors, and business consultants looking for reliable data.
Who Can Benefit from This Product?
- Investors: Accurately evaluate the fair value of Gansu Yasheng Industrial (Group) Co., Ltd. (600108SS) before making investment choices.
- CFOs: Utilize a professional-grade DCF model for comprehensive financial reporting and analysis.
- Consultants: Efficiently customize the template for client valuation reports.
- Entrepreneurs: Acquire insights into financial modeling practices employed by leading companies.
- Educators: Employ it as a teaching resource to illustrate various valuation methods.
Contents of the Template
- Historical Data: Provides Gansu Yasheng Industrial's past financial information and baseline projections.
- DCF and Levered DCF Models: Comprehensive templates for assessing the intrinsic value of Gansu Yasheng Industrial (600108SS).
- WACC Sheet: Pre-calculated figures for the Weighted Average Cost of Capital.
- Editable Inputs: Customize essential variables such as growth rates, EBITDA margins, and CAPEX forecasts.
- Quarterly and Annual Statements: An extensive overview of Gansu Yasheng Industrial's financial performance.
- Interactive Dashboard: Dynamically visualize valuation outcomes and projections.
Disclaimer
All information, articles, and product details provided on this website are for general informational and educational purposes only. We do not claim any ownership over, nor do we intend to infringe upon, any trademarks, copyrights, logos, brand names, or other intellectual property mentioned or depicted on this site. Such intellectual property remains the property of its respective owners, and any references here are made solely for identification or informational purposes, without implying any affiliation, endorsement, or partnership.
We make no representations or warranties, express or implied, regarding the accuracy, completeness, or suitability of any content or products presented. Nothing on this website should be construed as legal, tax, investment, financial, medical, or other professional advice. In addition, no part of this site—including articles or product references—constitutes a solicitation, recommendation, endorsement, advertisement, or offer to buy or sell any securities, franchises, or other financial instruments, particularly in jurisdictions where such activity would be unlawful.
All content is of a general nature and may not address the specific circumstances of any individual or entity. It is not a substitute for professional advice or services. Any actions you take based on the information provided here are strictly at your own risk. You accept full responsibility for any decisions or outcomes arising from your use of this website and agree to release us from any liability in connection with your use of, or reliance upon, the content or products found herein.