
|
Zhongmin Energy Co., Ltd. (600163.SS) Avaliação DCF |
Totalmente Editável: Adapte-Se Às Suas Necessidades No Excel Ou Planilhas
Design Profissional: Modelos Confiáveis E Padrão Da Indústria
Pré-Construídos Para Uso Rápido E Eficiente
Compatível com MAC/PC, totalmente desbloqueado
Não É Necessária Experiência; Fácil De Seguir
Zhongmin Energy Co., Ltd. (600163.SS) Bundle
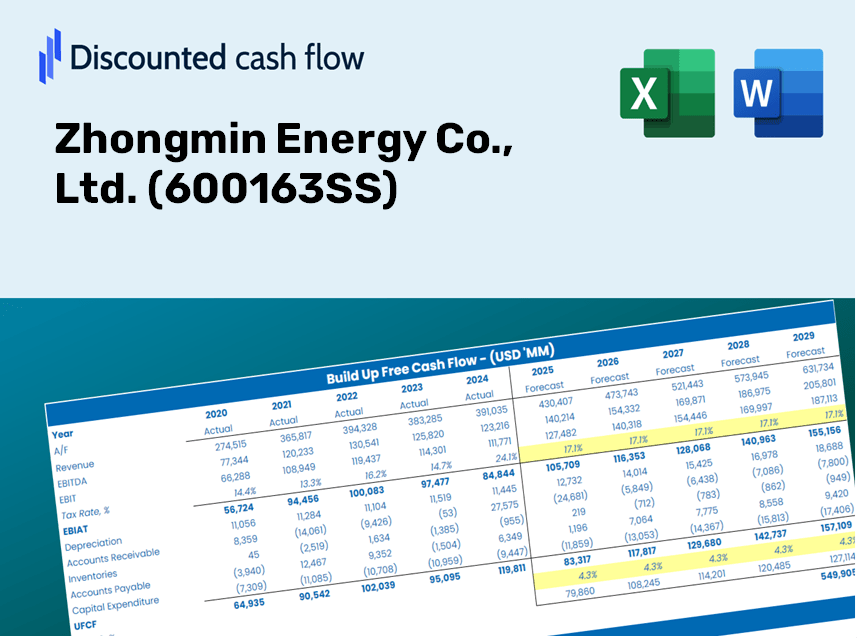
Explore as perspectivas financeiras da Zhongmin Energy Co., Ltd. (600163Ss) com nossa calculadora DCF amigável! Basta inserir suas suposições sobre crescimento, margens e despesas para calcular o valor intrínseco da Zhongmin Energy Co., Ltd. (600163Ss) e refinar sua estratégia de investimento.
Discounted Cash Flow (DCF) - (USD MM)
| Year | AY1 2020 |
AY2 2021 |
AY3 2022 |
AY4 2023 |
AY5 2024 |
FY1 2025 |
FY2 2026 |
FY3 2027 |
FY4 2028 |
FY5 2029 |
|---|---|---|---|---|---|---|---|---|---|---|
| Revenue | 1,252.0 | 1,559.5 | 1,790.9 | 1,731.8 | 1,741.2 | 1,900.7 | 2,074.8 | 2,264.9 | 2,472.3 | 2,698.8 |
| Revenue Growth, % | 0 | 24.56 | 14.84 | -3.3 | 0.54259 | 9.16 | 9.16 | 9.16 | 9.16 | 9.16 |
| EBITDA | 1,083.2 | 1,353.4 | 1,541.8 | 1,465.5 | 1,435.0 | 1,621.0 | 1,769.5 | 1,931.6 | 2,108.5 | 2,301.7 |
| EBITDA, % | 86.52 | 86.78 | 86.09 | 84.62 | 82.41 | 85.29 | 85.29 | 85.29 | 85.29 | 85.29 |
| Depreciation | 308.6 | 409.7 | 492.5 | 501.8 | 501.2 | 517.7 | 565.1 | 616.8 | 673.3 | 735.0 |
| Depreciation, % | 24.65 | 26.27 | 27.5 | 28.98 | 28.78 | 27.23 | 27.23 | 27.23 | 27.23 | 27.23 |
| EBIT | 774.6 | 943.7 | 1,049.3 | 963.7 | 933.8 | 1,103.4 | 1,204.4 | 1,314.8 | 1,435.2 | 1,566.7 |
| EBIT, % | 61.87 | 60.51 | 58.59 | 55.65 | 53.63 | 58.05 | 58.05 | 58.05 | 58.05 | 58.05 |
| Total Cash | 896.3 | 883.3 | 1,371.9 | 1,413.7 | 1,420.0 | 1,399.0 | 1,527.2 | 1,667.0 | 1,819.8 | 1,986.4 |
| Total Cash, percent | .0 | .0 | .0 | .0 | .0 | .0 | .0 | .0 | .0 | .0 |
| Account Receivables | 1,085.5 | 1,699.6 | 2,000.4 | 2,467.2 | 3,069.5 | 1,850.1 | 2,019.6 | 2,204.6 | 2,406.6 | 2,627.0 |
| Account Receivables, % | 86.7 | 108.98 | 111.69 | 142.46 | 176.29 | 97.34 | 97.34 | 97.34 | 97.34 | 97.34 |
| Inventories | 24.3 | 30.4 | 37.4 | 32.0 | 44.9 | 39.5 | 43.1 | 47.1 | 51.4 | 56.1 |
| Inventories, % | 1.94 | 1.95 | 2.09 | 1.85 | 2.58 | 2.08 | 2.08 | 2.08 | 2.08 | 2.08 |
| Accounts Payable | 1,324.9 | 1,032.9 | 935.8 | 879.9 | 852.9 | 1,209.9 | 1,320.7 | 1,441.7 | 1,573.8 | 1,717.9 |
| Accounts Payable, % | 105.82 | 66.23 | 52.25 | 50.81 | 48.98 | 63.66 | 63.66 | 63.66 | 63.66 | 63.66 |
| Capital Expenditure | -878.0 | -544.3 | -217.2 | -93.0 | -59.7 | -478.8 | -522.7 | -570.5 | -622.8 | -679.9 |
| Capital Expenditure, % | -70.13 | -34.9 | -12.13 | -5.37 | -3.43 | -25.19 | -25.19 | -25.19 | -25.19 | -25.19 |
| Tax Rate, % | 20.71 | 20.71 | 20.71 | 20.71 | 20.71 | 20.71 | 20.71 | 20.71 | 20.71 | 20.71 |
| EBITAT | 621.4 | 825.6 | 834.3 | 758.4 | 740.4 | 894.2 | 976.1 | 1,065.5 | 1,163.1 | 1,269.6 |
| Depreciation | ||||||||||
| Changes in Account Receivables | ||||||||||
| Changes in Inventories | ||||||||||
| Changes in Accounts Payable | ||||||||||
| Capital Expenditure | ||||||||||
| UFCF | 267.2 | -221.3 | 704.6 | 650.1 | 539.6 | 2,514.8 | 956.2 | 1,043.8 | 1,139.4 | 1,243.8 |
| WACC, % | 4.52 | 4.58 | 4.51 | 4.5 | 4.51 | 4.52 | 4.52 | 4.52 | 4.52 | 4.52 |
| PV UFCF | ||||||||||
| SUM PV UFCF | 6,147.0 | |||||||||
| Long Term Growth Rate, % | 2.00 | |||||||||
| Free cash flow (T + 1) | 1,269 | |||||||||
| Terminal Value | 50,303 | |||||||||
| Present Terminal Value | 40,323 | |||||||||
| Enterprise Value | 46,470 | |||||||||
| Net Debt | 644 | |||||||||
| Equity Value | 45,826 | |||||||||
| Diluted Shares Outstanding, MM | 1,903 | |||||||||
| Equity Value Per Share | 24.08 |
What You Will Receive
- Customizable Excel Template: A fully adaptable Excel-based DCF Calculator featuring pre-filled financial data for Zhongmin Energy Co., Ltd. (600163SS).
- Actual Market Data: Access to historical performance data and forward-looking projections (highlighted in the yellow cells).
- Adjustable Forecasts: Modify key assumptions such as revenue growth, EBITDA percentages, and WACC.
- Real-Time Calculations: Instantly observe how your inputs influence the valuation of Zhongmin Energy Co., Ltd. (600163SS).
- Professional-Grade Tool: Designed for investors, CFOs, consultants, and financial analysts.
- User-Centric Interface: Organized for straightforward navigation and ease of use, complete with step-by-step guidance.
Core Features
- Authentic Financial Data: Gain access to reliable historical data and future estimates related to Zhongmin Energy Co., Ltd. (600163SS).
- Adjustable Forecast Parameters: Modify highlighted cells for key metrics such as WACC, growth rates, and profit margins.
- Real-Time Calculations: Automatic updates for DCF, Net Present Value (NPV), and cash flow evaluations.
- User-Friendly Dashboard: Intuitive charts and summaries designed to help you easily interpret your valuation results.
- Suitable for All Experience Levels: A straightforward layout crafted for investors, CFOs, and consultants alike.
How It Functions
- Step 1: Download the ready-to-use Excel template featuring Zhongmin Energy Co., Ltd. (600163SS) data.
- Step 2: Review the pre-populated sheets to familiarize yourself with the essential metrics.
- Step 3: Adjust forecasts and assumptions in the editable yellow cells (WACC, growth, margins).
- Step 4: Instantly see the updated results, including the intrinsic value of Zhongmin Energy Co., Ltd. (600163SS).
- Step 5: Use the outputs to make educated investment choices or create reports.
Why Opt for This Calculator?
- Reliable Data: Utilize authentic Zhongmin Energy financials for dependable valuation outcomes.
- Flexible Settings: Modify essential variables such as growth rates, WACC, and tax rates to align with your forecasts.
- Efficiency Boost: Pre-configured calculations save you the hassle of starting from the beginning.
- Professional Tool: Tailored for investors, analysts, and consultants in the energy sector.
- User-Friendly Design: An intuitive interface and clear guidance simplify use for all users.
Who Can Benefit from Zhongmin Energy Co., Ltd. (600163SS)?
- Energy Sector Students: Discover valuation strategies and engage with real-world data relevant to the energy industry.
- Researchers: Utilize established models in your academic pursuits or research projects focused on energy markets.
- Investors: Validate your investment hypotheses and assess valuation scenarios for Zhongmin Energy Co., Ltd. (600163SS).
- Financial Analysts: Enhance your efficiency with a ready-to-use, customizable discounted cash flow (DCF) model tailored for energy companies.
- Entrepreneurs in Energy: Learn how industry giants are evaluated to better understand market dynamics and strategic positioning.
Contents of the Template
- Pre-Filled Data: Contains Zhongmin Energy’s historical financial data and projections.
- Discounted Cash Flow Model: An editable DCF valuation model with automated calculations.
- Weighted Average Cost of Capital (WACC): A dedicated sheet for WACC calculations based on user-defined inputs.
- Key Financial Ratios: Assess Zhongmin Energy’s profitability, efficiency, and leverage metrics.
- Customizable Inputs: Easily modify revenue growth, profit margins, and tax rates.
- Clear Dashboard: Visual representations including charts and tables to summarize key valuation outcomes.
Disclaimer
All information, articles, and product details provided on this website are for general informational and educational purposes only. We do not claim any ownership over, nor do we intend to infringe upon, any trademarks, copyrights, logos, brand names, or other intellectual property mentioned or depicted on this site. Such intellectual property remains the property of its respective owners, and any references here are made solely for identification or informational purposes, without implying any affiliation, endorsement, or partnership.
We make no representations or warranties, express or implied, regarding the accuracy, completeness, or suitability of any content or products presented. Nothing on this website should be construed as legal, tax, investment, financial, medical, or other professional advice. In addition, no part of this site—including articles or product references—constitutes a solicitation, recommendation, endorsement, advertisement, or offer to buy or sell any securities, franchises, or other financial instruments, particularly in jurisdictions where such activity would be unlawful.
All content is of a general nature and may not address the specific circumstances of any individual or entity. It is not a substitute for professional advice or services. Any actions you take based on the information provided here are strictly at your own risk. You accept full responsibility for any decisions or outcomes arising from your use of this website and agree to release us from any liability in connection with your use of, or reliance upon, the content or products found herein.