
|
Anhui Golden Seed Winery Co., Ltd. (600199.SS) Avaliação DCF |
Totalmente Editável: Adapte-Se Às Suas Necessidades No Excel Ou Planilhas
Design Profissional: Modelos Confiáveis E Padrão Da Indústria
Pré-Construídos Para Uso Rápido E Eficiente
Compatível com MAC/PC, totalmente desbloqueado
Não É Necessária Experiência; Fácil De Seguir
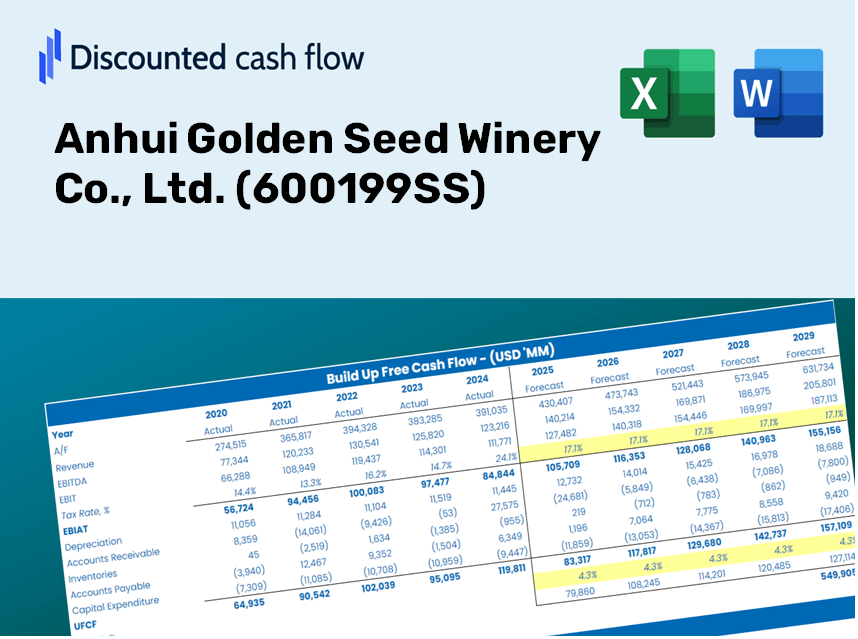
Anhui Golden Seed Winery Co., Ltd. (600199.SS) Bundle
Descubra o verdadeiro valor da Anhui Golden Seed Winery Co., Ltd. (600199Ss) com nossa calculadora DCF avançada! Ajuste as suposições críticas, explore vários cenários e avalie como os ajustes afetam a avaliação da Anhui Golden Seed Winery Co., Ltd. (600199Ss)-tudo dentro de um modelo de excel amigável.
Discounted Cash Flow (DCF) - (USD MM)
| Year | AY1 2020 |
AY2 2021 |
AY3 2022 |
AY4 2023 |
AY5 2024 |
FY1 2025 |
FY2 2026 |
FY3 2027 |
FY4 2028 |
FY5 2029 |
|---|---|---|---|---|---|---|---|---|---|---|
| Revenue | 1,037.9 | 1,211.3 | 1,185.8 | 1,469.4 | 925.2 | 928.6 | 932.0 | 935.5 | 939.0 | 942.4 |
| Revenue Growth, % | 0 | 16.7 | -2.11 | 23.92 | -37.04 | 0.37002 | 0.37002 | 0.37002 | 0.37002 | 0.37002 |
| EBITDA | -177.8 | -137.9 | -118.0 | 61.7 | -188.6 | -101.5 | -101.9 | -102.3 | -102.6 | -103.0 |
| EBITDA, % | -17.13 | -11.39 | -9.95 | 4.2 | -20.38 | -10.93 | -10.93 | -10.93 | -10.93 | -10.93 |
| Depreciation | 41.8 | 45.3 | 48.5 | 57.5 | 62.3 | 41.8 | 42.0 | 42.1 | 42.3 | 42.4 |
| Depreciation, % | 4.03 | 3.74 | 4.09 | 3.91 | 6.73 | 4.5 | 4.5 | 4.5 | 4.5 | 4.5 |
| EBIT | -219.6 | -183.2 | -166.5 | 4.2 | -250.9 | -143.3 | -143.8 | -144.4 | -144.9 | -145.4 |
| EBIT, % | -21.16 | -15.12 | -14.04 | 0.28287 | -27.11 | -15.43 | -15.43 | -15.43 | -15.43 | -15.43 |
| Total Cash | 1,354.6 | 990.3 | 510.6 | 507.3 | 366.7 | 555.3 | 557.3 | 559.4 | 561.5 | 563.5 |
| Total Cash, percent | .0 | .0 | .0 | .0 | .0 | .0 | .0 | .0 | .0 | .0 |
| Account Receivables | 157.8 | 225.4 | 226.6 | 177.6 | 90.6 | 138.9 | 139.4 | 139.9 | 140.5 | 141.0 |
| Account Receivables, % | 15.2 | 18.61 | 19.11 | 12.09 | 9.79 | 14.96 | 14.96 | 14.96 | 14.96 | 14.96 |
| Inventories | 969.3 | 1,341.9 | 1,328.6 | 1,467.4 | 1,539.5 | 916.1 | 919.5 | 922.9 | 926.3 | 929.7 |
| Inventories, % | 93.39 | 110.78 | 112.04 | 99.86 | 166.4 | 98.65 | 98.65 | 98.65 | 98.65 | 98.65 |
| Accounts Payable | 450.0 | 360.6 | 329.9 | 422.8 | 293.5 | 299.9 | 301.0 | 302.1 | 303.2 | 304.3 |
| Accounts Payable, % | 43.36 | 29.77 | 27.83 | 28.77 | 31.72 | 32.29 | 32.29 | 32.29 | 32.29 | 32.29 |
| Capital Expenditure | -77.6 | -64.1 | -67.8 | -73.2 | -82.8 | -60.2 | -60.4 | -60.7 | -60.9 | -61.1 |
| Capital Expenditure, % | -7.48 | -5.29 | -5.72 | -4.98 | -8.95 | -6.48 | -6.48 | -6.48 | -6.48 | -6.48 |
| Tax Rate, % | -2.1 | -2.1 | -2.1 | -2.1 | -2.1 | -2.1 | -2.1 | -2.1 | -2.1 | -2.1 |
| EBITAT | -339.8 | -185.7 | -186.3 | -26.6 | -256.1 | -114.6 | -115.1 | -115.5 | -115.9 | -116.3 |
| Depreciation | ||||||||||
| Changes in Account Receivables | ||||||||||
| Changes in Inventories | ||||||||||
| Changes in Accounts Payable | ||||||||||
| Capital Expenditure | ||||||||||
| UFCF | -1,052.5 | -734.1 | -224.2 | -39.2 | -391.0 | 448.4 | -136.3 | -136.8 | -137.3 | -137.9 |
| WACC, % | 8.63 | 8.63 | 8.63 | 8.53 | 8.63 | 8.61 | 8.61 | 8.61 | 8.61 | 8.61 |
| PV UFCF | ||||||||||
| SUM PV UFCF | .6 | |||||||||
| Long Term Growth Rate, % | 2.00 | |||||||||
| Free cash flow (T + 1) | -141 | |||||||||
| Terminal Value | -2,128 | |||||||||
| Present Terminal Value | -1,408 | |||||||||
| Enterprise Value | -1,408 | |||||||||
| Net Debt | -168 | |||||||||
| Equity Value | -1,239 | |||||||||
| Diluted Shares Outstanding, MM | 660 | |||||||||
| Equity Value Per Share | -1.88 |
What You Will Receive
- Authentic Anhui Golden Seed Data: Preloaded financial metrics – from revenue to EBIT – based on verified and projected figures.
- Comprehensive Customization: Modify all key variables (yellow cells) such as WACC, growth %, and tax rates.
- Real-Time Valuation Adjustments: Automatic recalculations to evaluate the effects of changes on Anhui Golden Seed’s fair value.
- User-Friendly Excel Template: Designed for quick modifications, scenario analysis, and detailed forecasting.
- Efficient and Precise: Eliminate the need to build models from scratch while ensuring accuracy and adaptability.
Key Features
- Accurate Financial Data: Gain access to reliable pre-loaded historical financials and future outlooks for Anhui Golden Seed Winery Co., Ltd. (600199SS).
- Customizable Forecast Parameters: Modify the yellow-highlighted cells for key metrics such as WACC, growth rates, and profit margins.
- Real-time Calculations: Automatic updates for DCF, Net Present Value (NPV), and cash flow assessments.
- User-friendly Dashboard: Intuitive charts and summaries designed to help you easily visualize your valuation findings.
- Suitable for All Skill Levels: A straightforward, easy-to-navigate layout tailored for investors, CFOs, and consultants alike.
How It Works
- Step 1: Download the Excel file.
- Step 2: Examine the pre-filled financial data and forecasts for Anhui Golden Seed Winery Co., Ltd. (600199SS).
- Step 3: Adjust key variables such as revenue growth, WACC, and tax rates (highlighted cells).
- Step 4: Observe the DCF model refresh in real-time as you modify your assumptions.
- Step 5: Review the outputs and leverage the results for informed investment decisions.
Why Opt for Anhui Golden Seed Winery's Calculator?
- All-in-One Tool: Combines DCF, WACC, and detailed financial ratio analyses for a complete evaluation.
- Flexible Inputs: Modify the highlighted cells to explore different financial scenarios.
- In-Depth Analysis: Automatically determines the intrinsic value and Net Present Value for Anhui Golden Seed Winery (600199SS).
- Pre-Loaded Information: Access to historical and projected data for precise calculations.
- High-Quality Standards: Perfectly suited for financial analysts, investors, and business consultants.
Who Can Benefit from This Product?
- Investors: Evaluate Anhui Golden Seed Winery's valuation prior to trading stocks.
- CFOs and Financial Analysts: Optimize valuation workflows and assess financial forecasts.
- Startup Founders: Gain insights into how prominent public companies like Anhui Golden Seed Winery are appraised.
- Consultants: Provide comprehensive valuation reports to clients in the wine industry.
- Students and Educators: Utilize real-life data to practice and instruct valuation methodologies.
What the Template Includes
- Preloaded AGSW Data: Historical and projected financial information, encompassing revenue, EBIT, and capital expenditures.
- DCF and WACC Models: High-quality sheets designed for calculating intrinsic value and Weighted Average Cost of Capital.
- Editable Inputs: Yellow-highlighted cells for modifying revenue growth rates, tax rates, and discount rates.
- Financial Statements: Detailed annual and quarterly financial reports for in-depth analysis.
- Key Ratios: Metrics for profitability, leverage, and efficiency to assess performance.
- Dashboard and Charts: Visual representations of valuation outcomes and underlying assumptions.
Disclaimer
All information, articles, and product details provided on this website are for general informational and educational purposes only. We do not claim any ownership over, nor do we intend to infringe upon, any trademarks, copyrights, logos, brand names, or other intellectual property mentioned or depicted on this site. Such intellectual property remains the property of its respective owners, and any references here are made solely for identification or informational purposes, without implying any affiliation, endorsement, or partnership.
We make no representations or warranties, express or implied, regarding the accuracy, completeness, or suitability of any content or products presented. Nothing on this website should be construed as legal, tax, investment, financial, medical, or other professional advice. In addition, no part of this site—including articles or product references—constitutes a solicitation, recommendation, endorsement, advertisement, or offer to buy or sell any securities, franchises, or other financial instruments, particularly in jurisdictions where such activity would be unlawful.
All content is of a general nature and may not address the specific circumstances of any individual or entity. It is not a substitute for professional advice or services. Any actions you take based on the information provided here are strictly at your own risk. You accept full responsibility for any decisions or outcomes arising from your use of this website and agree to release us from any liability in connection with your use of, or reliance upon, the content or products found herein.