
|
Jinyu Bio-Technology Co., Ltd. (600201.SS) DCF Avaliação |
Totalmente Editável: Adapte-Se Às Suas Necessidades No Excel Ou Planilhas
Design Profissional: Modelos Confiáveis E Padrão Da Indústria
Pré-Construídos Para Uso Rápido E Eficiente
Compatível com MAC/PC, totalmente desbloqueado
Não É Necessária Experiência; Fácil De Seguir
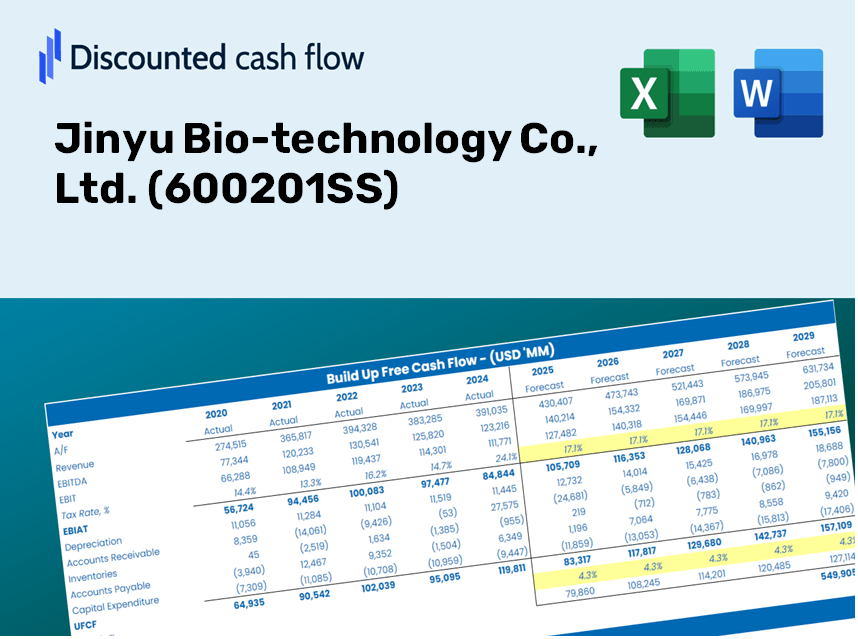
Jinyu Bio-technology Co., Ltd. (600201.SS) Bundle
Procurando avaliar o valor intrínseco da Jinyu Bio-Technology Co., Ltd.? Nossa calculadora DCF (600201SS) integra dados do mundo real com recursos abrangentes de personalização, permitindo ajustar as previsões e aprimorar suas estratégias de investimento.
Discounted Cash Flow (DCF) - (USD MM)
| Year | AY1 2020 |
AY2 2021 |
AY3 2022 |
AY4 2023 |
AY5 2024 |
FY1 2025 |
FY2 2026 |
FY3 2027 |
FY4 2028 |
FY5 2029 |
|---|---|---|---|---|---|---|---|---|---|---|
| Revenue | 1,581.9 | 1,776.3 | 1,528.7 | 1,598.2 | 1,255.5 | 1,197.2 | 1,141.7 | 1,088.8 | 1,038.3 | 990.1 |
| Revenue Growth, % | 0 | 12.29 | -13.94 | 4.55 | -21.45 | -4.64 | -4.64 | -4.64 | -4.64 | -4.64 |
| EBITDA | 580.6 | 585.2 | 450.9 | 437.2 | 246.6 | 349.9 | 333.7 | 318.2 | 303.5 | 289.4 |
| EBITDA, % | 36.7 | 32.94 | 29.5 | 27.35 | 19.64 | 29.23 | 29.23 | 29.23 | 29.23 | 29.23 |
| Depreciation | 173.6 | 191.0 | 198.9 | 188.5 | 209.4 | 151.4 | 144.3 | 137.7 | 131.3 | 125.2 |
| Depreciation, % | 10.98 | 10.75 | 13.01 | 11.79 | 16.68 | 12.64 | 12.64 | 12.64 | 12.64 | 12.64 |
| EBIT | 407.0 | 394.2 | 252.0 | 248.7 | 37.2 | 198.6 | 189.4 | 180.6 | 172.2 | 164.2 |
| EBIT, % | 25.73 | 22.19 | 16.49 | 15.56 | 2.96 | 16.59 | 16.59 | 16.59 | 16.59 | 16.59 |
| Total Cash | 2,155.5 | 1,518.0 | 1,452.4 | 1,749.5 | 1,176.4 | 1,135.4 | 1,082.7 | 1,032.5 | 984.6 | 939.0 |
| Total Cash, percent | .0 | .0 | .0 | .0 | .0 | .0 | .0 | .0 | .0 | .0 |
| Account Receivables | 663.7 | 742.9 | 816.6 | 903.5 | 682.3 | 594.0 | 566.5 | 540.2 | 515.2 | 491.3 |
| Account Receivables, % | 41.96 | 41.82 | 53.42 | 56.53 | 54.35 | 49.62 | 49.62 | 49.62 | 49.62 | 49.62 |
| Inventories | 350.7 | 317.7 | 333.5 | 322.3 | 294.6 | 252.6 | 240.9 | 229.7 | 219.1 | 208.9 |
| Inventories, % | 22.17 | 17.88 | 21.81 | 20.16 | 23.47 | 21.1 | 21.1 | 21.1 | 21.1 | 21.1 |
| Accounts Payable | 330.3 | 347.1 | 354.4 | 324.4 | 295.8 | 257.3 | 245.4 | 234.0 | 223.2 | 212.8 |
| Accounts Payable, % | 20.88 | 19.54 | 23.18 | 20.3 | 23.56 | 21.49 | 21.49 | 21.49 | 21.49 | 21.49 |
| Capital Expenditure | -228.3 | -372.7 | -190.1 | -273.2 | -89.7 | -172.6 | -164.6 | -157.0 | -149.7 | -142.7 |
| Capital Expenditure, % | -14.43 | -20.98 | -12.44 | -17.09 | -7.14 | -14.42 | -14.42 | -14.42 | -14.42 | -14.42 |
| Tax Rate, % | 12.75 | 12.75 | 12.75 | 12.75 | 12.75 | 12.75 | 12.75 | 12.75 | 12.75 | 12.75 |
| EBITAT | 347.1 | 364.6 | 216.2 | 223.3 | 32.5 | 175.0 | 166.9 | 159.1 | 151.8 | 144.7 |
| Depreciation | ||||||||||
| Changes in Account Receivables | ||||||||||
| Changes in Inventories | ||||||||||
| Changes in Accounts Payable | ||||||||||
| Capital Expenditure | ||||||||||
| UFCF | -391.6 | 153.5 | 142.8 | 33.0 | 372.4 | 245.6 | 173.9 | 165.9 | 158.2 | 150.9 |
| WACC, % | 7.12 | 7.12 | 7.12 | 7.12 | 7.12 | 7.12 | 7.12 | 7.12 | 7.12 | 7.12 |
| PV UFCF | ||||||||||
| SUM PV UFCF | 742.9 | |||||||||
| Long Term Growth Rate, % | 3.50 | |||||||||
| Free cash flow (T + 1) | 156 | |||||||||
| Terminal Value | 4,315 | |||||||||
| Present Terminal Value | 3,059 | |||||||||
| Enterprise Value | 3,802 | |||||||||
| Net Debt | -1,123 | |||||||||
| Equity Value | 4,926 | |||||||||
| Diluted Shares Outstanding, MM | 1,099 | |||||||||
| Equity Value Per Share | 4.48 |
What You Will Receive
- Actual Jinyu Financials: Provides historical and projected data for precise valuation.
- Customizable Inputs: Adjust metrics such as WACC, tax rates, revenue growth, and capital expenditures.
- Real-Time Calculations: Intrinsic value and NPV are computed automatically.
- Scenario Analysis: Explore various scenarios to assess Jinyu's future performance.
- User-Friendly Interface: Designed for industry professionals while remaining accessible for newcomers.
Key Features
- Comprehensive DCF Calculator: Provides both unlevered and levered DCF valuation models tailored for Jinyu Bio-technology Co., Ltd. (600201SS).
- WACC Calculator: Includes a pre-configured Weighted Average Cost of Capital sheet with options for user-defined inputs.
- Customizable Forecast Assumptions: Adjust growth projections, capital expenditures, and discount rates as needed.
- Integrated Financial Ratios: Evaluate profitability, leverage, and efficiency ratios specific to Jinyu Bio-technology Co., Ltd. (600201SS).
- Dynamic Dashboard and Charts: Visualizations present essential valuation metrics for straightforward analysis.
How It Functions
- Download the Template: Gain immediate access to the Excel-based Jinyu Bio-technology (600201SS) DCF Calculator.
- Input Your Assumptions: Modify the yellow-highlighted cells to reflect growth rates, WACC, margins, and additional parameters.
- Instant Calculations: The model will automatically recalculate the intrinsic value of Jinyu Bio-technology.
- Test Scenarios: Experiment with various assumptions to assess potential changes in valuation.
- Analyze and Decide: Utilize the results to inform your investment strategies or financial assessments.
Why Choose This Calculator for Jinyu Bio-technology Co., Ltd. (600201SS)?
- User-Friendly Interface: Ideal for both novices and seasoned professionals.
- Customizable Inputs: Adjust parameters easily to suit your financial analysis.
- Real-Time Adjustments: Witness immediate changes in Jinyu's valuation as you modify inputs.
- Preloaded Financials: Comes with Jinyu's actual financial data for swift evaluations.
- Relied Upon by Experts: Favored by investors and analysts for strategic decision-making.
Who Should Utilize This Product?
- Investors: Evaluate Jinyu Bio-technology Co., Ltd.'s (600201SS) valuation prior to making stock transactions.
- CFOs and Financial Analysts: Optimize valuation procedures and assess financial forecasts for Jinyu Bio-technology Co., Ltd. (600201SS).
- Startup Founders: Understand the valuation methodologies applied to established companies like Jinyu Bio-technology Co., Ltd. (600201SS).
- Consultants: Provide expert valuation reports to clients featuring Jinyu Bio-technology Co., Ltd. (600201SS).
- Students and Educators: Utilize real-world case studies from Jinyu Bio-technology Co., Ltd. (600201SS) to practice and teach valuation skills.
Contents of the Template
- Historical Data: Provides Jinyu Bio-technology Co., Ltd.'s past financial performance and baseline projections.
- DCF and Levered DCF Models: Comprehensive templates to assess the intrinsic value of Jinyu Bio-technology Co., Ltd. (600201SS).
- WACC Sheet: Pre-formulated calculations for the Weighted Average Cost of Capital.
- Editable Inputs: Adjust critical drivers such as growth rates, EBITDA percentages, and CAPEX assumptions.
- Quarterly and Annual Statements: A thorough analysis of Jinyu Bio-technology Co., Ltd.'s financial statements.
- Interactive Dashboard: Dynamically visualize valuation outcomes and forecasts.
Disclaimer
All information, articles, and product details provided on this website are for general informational and educational purposes only. We do not claim any ownership over, nor do we intend to infringe upon, any trademarks, copyrights, logos, brand names, or other intellectual property mentioned or depicted on this site. Such intellectual property remains the property of its respective owners, and any references here are made solely for identification or informational purposes, without implying any affiliation, endorsement, or partnership.
We make no representations or warranties, express or implied, regarding the accuracy, completeness, or suitability of any content or products presented. Nothing on this website should be construed as legal, tax, investment, financial, medical, or other professional advice. In addition, no part of this site—including articles or product references—constitutes a solicitation, recommendation, endorsement, advertisement, or offer to buy or sell any securities, franchises, or other financial instruments, particularly in jurisdictions where such activity would be unlawful.
All content is of a general nature and may not address the specific circumstances of any individual or entity. It is not a substitute for professional advice or services. Any actions you take based on the information provided here are strictly at your own risk. You accept full responsibility for any decisions or outcomes arising from your use of this website and agree to release us from any liability in connection with your use of, or reliance upon, the content or products found herein.