
|
Shanghai Zijiang Enterprise Group Co., Ltd. (600210.SS) DCF Avaliação |
Totalmente Editável: Adapte-Se Às Suas Necessidades No Excel Ou Planilhas
Design Profissional: Modelos Confiáveis E Padrão Da Indústria
Pré-Construídos Para Uso Rápido E Eficiente
Compatível com MAC/PC, totalmente desbloqueado
Não É Necessária Experiência; Fácil De Seguir
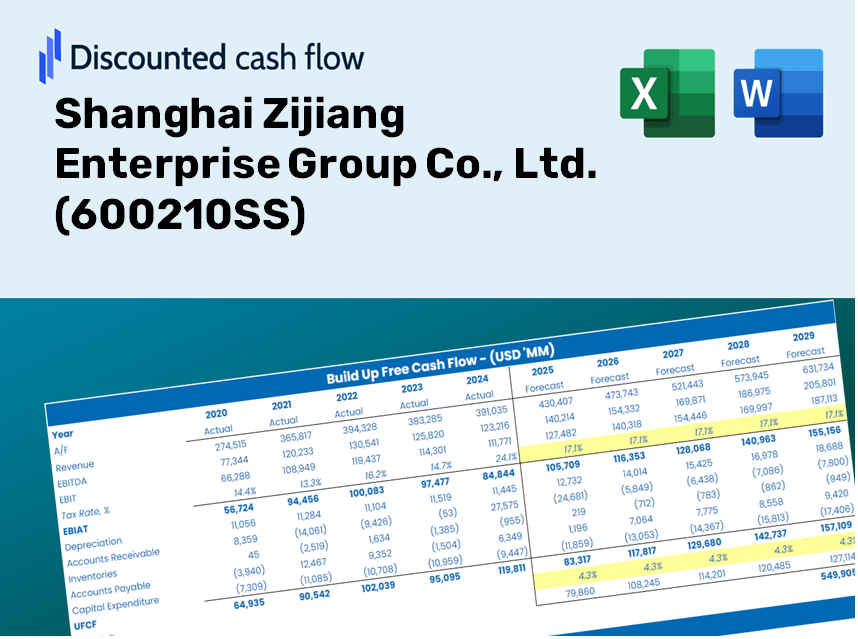
Shanghai Zijiang Enterprise Group Co., Ltd. (600210.SS) Bundle
Simplifique Shanghai Zijiang Enterprise Group Co., Ltd. (600210Ss) Avaliação com esta calculadora DCF personalizável! Com o Real Shanghai Zijiang Enterprise Group Co., Ltd. (600210SS) e entradas de previsão ajustáveis, você pode testar cenários e descobrir Shanghai Zijiang Enterprise Group Co., Ltd. (600210S) em minutos.
Discounted Cash Flow (DCF) - (USD MM)
| Year | AY1 2020 |
AY2 2021 |
AY3 2022 |
AY4 2023 |
AY5 2024 |
FY1 2025 |
FY2 2026 |
FY3 2027 |
FY4 2028 |
FY5 2029 |
|---|---|---|---|---|---|---|---|---|---|---|
| Revenue | 8,417.6 | 9,528.6 | 9,607.9 | 9,115.5 | 10,636.9 | 10,592.9 | 10,549.0 | 10,505.3 | 10,461.8 | 10,418.4 |
| Revenue Growth, % | 0 | 13.2 | 0.83275 | -5.13 | 16.69 | -0.41427 | -0.41427 | -0.41427 | -0.41427 | -0.41427 |
| EBITDA | 1,168.0 | 1,174.3 | 1,123.3 | 1,178.8 | 1,411.0 | 1,357.7 | 1,352.1 | 1,346.5 | 1,340.9 | 1,335.4 |
| EBITDA, % | 13.88 | 12.32 | 11.69 | 12.93 | 13.26 | 12.82 | 12.82 | 12.82 | 12.82 | 12.82 |
| Depreciation | 401.8 | 390.0 | 373.8 | 394.9 | 394.6 | 440.6 | 438.8 | 437.0 | 435.2 | 433.4 |
| Depreciation, % | 4.77 | 4.09 | 3.89 | 4.33 | 3.71 | 4.16 | 4.16 | 4.16 | 4.16 | 4.16 |
| EBIT | 766.2 | 784.4 | 749.5 | 783.9 | 1,016.4 | 917.1 | 913.3 | 909.5 | 905.8 | 902.0 |
| EBIT, % | 9.1 | 8.23 | 7.8 | 8.6 | 9.56 | 8.66 | 8.66 | 8.66 | 8.66 | 8.66 |
| Total Cash | 1,654.5 | 1,724.0 | 1,684.1 | 2,564.8 | 2,176.0 | 2,200.6 | 2,191.5 | 2,182.4 | 2,173.3 | 2,164.3 |
| Total Cash, percent | .0 | .0 | .0 | .0 | .0 | .0 | .0 | .0 | .0 | .0 |
| Account Receivables | 1,627.3 | 1,870.4 | 2,053.9 | 1,790.2 | 1,886.6 | 2,070.1 | 2,061.5 | 2,053.0 | 2,044.5 | 2,036.0 |
| Account Receivables, % | 19.33 | 19.63 | 21.38 | 19.64 | 17.74 | 19.54 | 19.54 | 19.54 | 19.54 | 19.54 |
| Inventories | 1,815.9 | 2,212.7 | 2,296.4 | 2,525.4 | 1,907.6 | 2,422.2 | 2,412.2 | 2,402.2 | 2,392.3 | 2,382.3 |
| Inventories, % | 21.57 | 23.22 | 23.9 | 27.7 | 17.93 | 22.87 | 22.87 | 22.87 | 22.87 | 22.87 |
| Accounts Payable | 1,092.0 | 1,023.4 | 700.8 | 1,320.9 | 952.1 | 1,153.5 | 1,148.8 | 1,144.0 | 1,139.3 | 1,134.5 |
| Accounts Payable, % | 12.97 | 10.74 | 7.29 | 14.49 | 8.95 | 10.89 | 10.89 | 10.89 | 10.89 | 10.89 |
| Capital Expenditure | -371.4 | -613.2 | -601.0 | -966.3 | -1,214.2 | -828.8 | -825.3 | -821.9 | -818.5 | -815.1 |
| Capital Expenditure, % | -4.41 | -6.43 | -6.26 | -10.6 | -11.41 | -7.82 | -7.82 | -7.82 | -7.82 | -7.82 |
| Tax Rate, % | 16.82 | 16.82 | 16.82 | 16.82 | 16.82 | 16.82 | 16.82 | 16.82 | 16.82 | 16.82 |
| EBITAT | 624.0 | 570.3 | 574.0 | 592.8 | 845.4 | 714.5 | 711.5 | 708.6 | 705.6 | 702.7 |
| Depreciation | ||||||||||
| Changes in Account Receivables | ||||||||||
| Changes in Inventories | ||||||||||
| Changes in Accounts Payable | ||||||||||
| Capital Expenditure | ||||||||||
| UFCF | -1,696.9 | -361.4 | -243.0 | 676.2 | 178.4 | -170.4 | 338.8 | 337.4 | 336.0 | 334.6 |
| WACC, % | 4.47 | 4.39 | 4.43 | 4.42 | 4.48 | 4.44 | 4.44 | 4.44 | 4.44 | 4.44 |
| PV UFCF | ||||||||||
| SUM PV UFCF | 995.4 | |||||||||
| Long Term Growth Rate, % | 3.50 | |||||||||
| Free cash flow (T + 1) | 346 | |||||||||
| Terminal Value | 36,939 | |||||||||
| Present Terminal Value | 29,730 | |||||||||
| Enterprise Value | 30,726 | |||||||||
| Net Debt | 1,396 | |||||||||
| Equity Value | 29,329 | |||||||||
| Diluted Shares Outstanding, MM | 1,517 | |||||||||
| Equity Value Per Share | 19.33 |
What You Will Receive
- Genuine (600210SS) Financial Data: Pre-loaded with Shanghai Zijiang Enterprise Group’s historical and projected metrics for accurate analysis.
- Completely Customizable Template: Effortlessly adjust key variables such as revenue growth, WACC, and EBITDA %.
- Instant Calculations: Watch the intrinsic value of (600210SS) refresh in real-time as you make modifications.
- Expert Valuation Tool: Tailored for investors, analysts, and consultants aiming for precise DCF outcomes.
- Intuitive Interface: A straightforward layout and clear guidance suitable for all skill levels.
Key Features
- Comprehensive DCF Calculator: Offers detailed unlevered and levered DCF valuation models tailored for Shanghai Zijiang Enterprise Group Co., Ltd. (600210SS).
- WACC Calculator: Features a pre-built Weighted Average Cost of Capital sheet with adjustable inputs specific to the company.
- Customizable Forecast Assumptions: Update growth rates, capital expenditures, and discount rates as needed.
- Integrated Financial Ratios: Evaluate key profitability, leverage, and efficiency ratios for Shanghai Zijiang Enterprise Group Co., Ltd. (600210SS).
- Visual Dashboard and Charts: Provides graphical outputs that summarize essential valuation metrics for straightforward analysis.
How It Operates
- Download the Template: Gain immediate access to the Excel-based Shanghai Zijiang Enterprise Group Co., Ltd. (600210SS) DCF Calculator.
- Input Your Assumptions: Modify the yellow-highlighted cells for growth rates, WACC, profit margins, and other variables.
- Instant Calculations: The model will automatically refresh to display the intrinsic value of Shanghai Zijiang Enterprise Group Co., Ltd. (600210SS).
- Test Scenarios: Experiment with various assumptions to assess potential changes in valuation.
- Analyze and Decide: Utilize the outcomes to inform your investment strategies or financial analyses.
Why Opt for This Calculator?
- Designed for Experts: A sophisticated tool utilized by analysts, CFOs, and consultants in the field.
- Accurate Data: Shanghai Zijiang Enterprise Group Co., Ltd.'s (600210SS) historical and projected financials preloaded for precise analysis.
- Forecast Simulation: Easily run various scenarios and assumptions to test different outcomes.
- Comprehensive Results: Automatically computes intrinsic value, NPV, and other key financial metrics.
- User-Friendly: Detailed step-by-step instructions to navigate the calculation process effortlessly.
Who Can Benefit from This Product?
- Investors: Make informed choices with a sophisticated valuation tool tailored for [600210SS].
- Financial Analysts: Enhance efficiency with a customizable DCF model specifically designed for [600210SS].
- Consultants: Effortlessly modify the template for presentations or reports related to [600210SS].
- Finance Enthusiasts: Expand your knowledge of valuation methods using practical examples connected to [600210SS].
- Educators and Students: Utilize this resource as a hands-on learning aid in finance courses focusing on [600210SS].
Components of the Template
- Historical Data: Contains Shanghai Zijiang Enterprise Group Co., Ltd.'s (600210SS) previous financials and baseline forecasts.
- DCF and Levered DCF Models: Comprehensive templates for assessing the intrinsic value of Shanghai Zijiang Enterprise Group Co., Ltd. (600210SS).
- WACC Sheet: Preconfigured calculations for the Weighted Average Cost of Capital.
- Editable Inputs: Adjust essential drivers such as growth rates, EBITDA percentages, and CAPEX assumptions.
- Quarterly and Annual Statements: A thorough breakdown of Shanghai Zijiang Enterprise Group Co., Ltd.'s (600210SS) financial performance.
- Interactive Dashboard: Dynamically visualize valuation results and future projections.
Disclaimer
All information, articles, and product details provided on this website are for general informational and educational purposes only. We do not claim any ownership over, nor do we intend to infringe upon, any trademarks, copyrights, logos, brand names, or other intellectual property mentioned or depicted on this site. Such intellectual property remains the property of its respective owners, and any references here are made solely for identification or informational purposes, without implying any affiliation, endorsement, or partnership.
We make no representations or warranties, express or implied, regarding the accuracy, completeness, or suitability of any content or products presented. Nothing on this website should be construed as legal, tax, investment, financial, medical, or other professional advice. In addition, no part of this site—including articles or product references—constitutes a solicitation, recommendation, endorsement, advertisement, or offer to buy or sell any securities, franchises, or other financial instruments, particularly in jurisdictions where such activity would be unlawful.
All content is of a general nature and may not address the specific circumstances of any individual or entity. It is not a substitute for professional advice or services. Any actions you take based on the information provided here are strictly at your own risk. You accept full responsibility for any decisions or outcomes arising from your use of this website and agree to release us from any liability in connection with your use of, or reliance upon, the content or products found herein.