
|
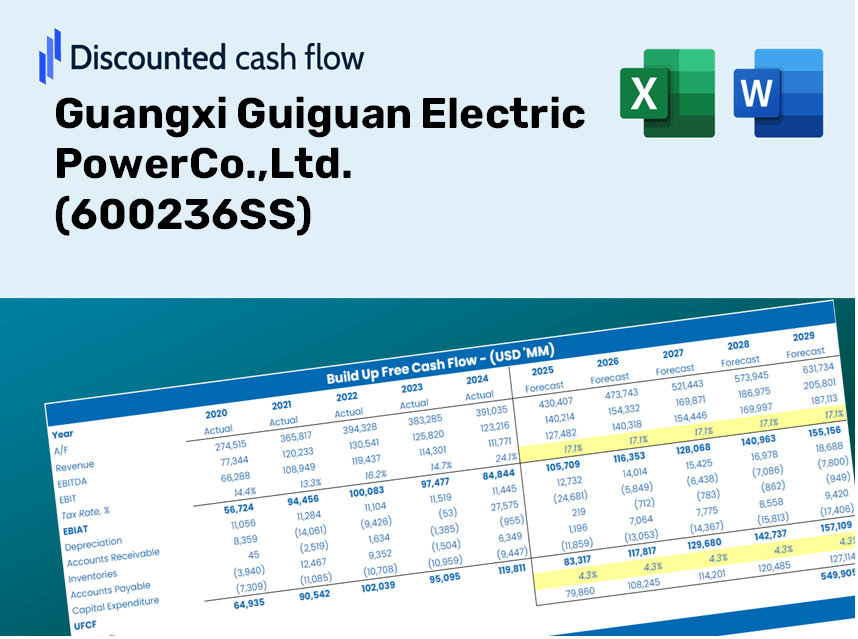
Guangxi Guiguan Electric Powerco., Ltd. (600236.SS) Avaliação do DCF |
Totalmente Editável: Adapte-Se Às Suas Necessidades No Excel Ou Planilhas
Design Profissional: Modelos Confiáveis E Padrão Da Indústria
Pré-Construídos Para Uso Rápido E Eficiente
Compatível com MAC/PC, totalmente desbloqueado
Não É Necessária Experiência; Fácil De Seguir
Guangxi Guiguan Electric PowerCo.,Ltd. (600236.SS) Bundle
Explore as perspectivas financeiras da Guangxi Guiguan Electric Power Co., Ltd. (600236Ss) com nossa calculadora DCF amigável! Digite suas projeções de crescimento, margens e despesas para calcular o valor intrínseco da Guiguan Electric Power Co., Ltd. (600236Ss) e molda sua abordagem de investimento.
Discounted Cash Flow (DCF) - (USD MM)
| Year | AY1 2020 |
AY2 2021 |
AY3 2022 |
AY4 2023 |
AY5 2024 |
FY1 2025 |
FY2 2026 |
FY3 2027 |
FY4 2028 |
FY5 2029 |
|---|---|---|---|---|---|---|---|---|---|---|
| Revenue | 8,973.9 | 8,589.5 | 10,624.7 | 8,091.0 | 9,598.4 | 9,939.0 | 10,291.6 | 10,656.8 | 11,034.9 | 11,426.5 |
| Revenue Growth, % | 0 | -4.28 | 23.69 | -23.85 | 18.63 | 3.55 | 3.55 | 3.55 | 3.55 | 3.55 |
| EBITDA | 6,155.7 | 4,889.8 | 6,936.9 | 4,122.0 | 6,031.8 | 6,054.8 | 6,269.7 | 6,492.1 | 6,722.5 | 6,961.0 |
| EBITDA, % | 68.6 | 56.93 | 65.29 | 50.95 | 62.84 | 60.92 | 60.92 | 60.92 | 60.92 | 60.92 |
| Depreciation | 2,256.8 | 2,038.1 | 2,080.4 | 2,146.4 | 2,238.1 | 2,351.6 | 2,435.1 | 2,521.5 | 2,610.9 | 2,703.6 |
| Depreciation, % | 25.15 | 23.73 | 19.58 | 26.53 | 23.32 | 23.66 | 23.66 | 23.66 | 23.66 | 23.66 |
| EBIT | 3,898.9 | 2,851.7 | 4,856.4 | 1,975.6 | 3,793.7 | 3,703.2 | 3,834.6 | 3,970.7 | 4,111.6 | 4,257.4 |
| EBIT, % | 43.45 | 33.2 | 45.71 | 24.42 | 39.52 | 37.26 | 37.26 | 37.26 | 37.26 | 37.26 |
| Total Cash | 1,883.9 | 1,561.9 | 597.2 | 740.4 | 965.7 | 1,272.4 | 1,317.5 | 1,364.3 | 1,412.7 | 1,462.8 |
| Total Cash, percent | .0 | .0 | .0 | .0 | .0 | .0 | .0 | .0 | .0 | .0 |
| Account Receivables | 1,312.2 | 1,455.2 | 1,458.5 | 1,696.6 | 2,152.4 | 1,762.9 | 1,825.4 | 1,890.2 | 1,957.2 | 2,026.7 |
| Account Receivables, % | 14.62 | 16.94 | 13.73 | 20.97 | 22.42 | 17.74 | 17.74 | 17.74 | 17.74 | 17.74 |
| Inventories | 164.6 | 241.6 | 190.2 | 244.1 | 475.4 | 286.4 | 296.5 | 307.0 | 317.9 | 329.2 |
| Inventories, % | 1.83 | 2.81 | 1.79 | 3.02 | 4.95 | 2.88 | 2.88 | 2.88 | 2.88 | 2.88 |
| Accounts Payable | 1,591.2 | 1,983.8 | 1,773.8 | 1,856.3 | 2,368.5 | 2,090.0 | 2,164.1 | 2,240.9 | 2,320.4 | 2,402.8 |
| Accounts Payable, % | 17.73 | 23.1 | 16.7 | 22.94 | 24.68 | 21.03 | 21.03 | 21.03 | 21.03 | 21.03 |
| Capital Expenditure | -2,610.0 | -1,530.5 | -3,754.8 | -3,693.8 | -3,986.2 | -3,367.8 | -3,487.3 | -3,611.1 | -3,739.2 | -3,871.9 |
| Capital Expenditure, % | -29.08 | -17.82 | -35.34 | -45.65 | -41.53 | -33.89 | -33.89 | -33.89 | -33.89 | -33.89 |
| Tax Rate, % | 26.06 | 26.06 | 26.06 | 26.06 | 26.06 | 26.06 | 26.06 | 26.06 | 26.06 | 26.06 |
| EBITAT | 2,891.9 | 2,091.2 | 3,706.0 | 1,533.1 | 2,805.1 | 2,780.0 | 2,878.7 | 2,980.8 | 3,086.6 | 3,196.1 |
| Depreciation | ||||||||||
| Changes in Account Receivables | ||||||||||
| Changes in Inventories | ||||||||||
| Changes in Accounts Payable | ||||||||||
| Capital Expenditure | ||||||||||
| UFCF | 2,653.1 | 2,771.4 | 1,869.7 | -223.9 | 882.2 | 2,063.8 | 1,827.9 | 1,892.7 | 1,959.9 | 2,029.4 |
| WACC, % | 4.04 | 4.04 | 4.06 | 4.08 | 4.04 | 4.05 | 4.05 | 4.05 | 4.05 | 4.05 |
| PV UFCF | ||||||||||
| SUM PV UFCF | 8,687.5 | |||||||||
| Long Term Growth Rate, % | 1.00 | |||||||||
| Free cash flow (T + 1) | 2,050 | |||||||||
| Terminal Value | 67,146 | |||||||||
| Present Terminal Value | 55,049 | |||||||||
| Enterprise Value | 63,737 | |||||||||
| Net Debt | 19,767 | |||||||||
| Equity Value | 43,970 | |||||||||
| Diluted Shares Outstanding, MM | 8,155 | |||||||||
| Equity Value Per Share | 5.39 |
What You Will Receive
- Pre-Loaded Financial Model: Utilizes Guangxi Guiguan Electric Power Co., Ltd.'s actual data for accurate DCF valuation.
- Comprehensive Forecast Control: Modify revenue growth, margins, WACC, and other critical factors.
- Real-Time Calculations: Automatic updates provide immediate insights as you make adjustments.
- Professional-Grade Template: A polished Excel file crafted for top-tier valuation needs.
- Flexible and Reusable: Designed for adaptability, enabling repeated application for extensive forecasts.
Key Features
- Comprehensive Historical Data: Access Guangxi Guiguan Electric Power Co., Ltd.'s (600236SS) detailed financial records and pre-filled projections.
- Customizable Inputs: Modify WACC, tax rates, revenue growth, and EBITDA margins to suit your analysis.
- Real-Time Insights: Watch as the intrinsic value of Guangxi Guiguan Electric Power Co., Ltd. (600236SS) updates instantly with each input change.
- Intuitive Visualizations: Interactive dashboard charts present valuation outcomes and essential metrics clearly.
- Designed for Precision: A reliable tool tailored for analysts, investors, and finance professionals.
How It Functions
- Step 1: Download the prebuilt Excel template containing Guangxi Guiguan Electric Power Co., Ltd.'s (600236SS) data.
- Step 2: Navigate through the populated sheets to familiarize yourself with the essential metrics.
- Step 3: Modify the forecasts and assumptions in the editable yellow cells (WACC, growth rates, profit margins).
- Step 4: Instantly see the updated results, including the intrinsic value of Guangxi Guiguan Electric Power Co., Ltd. (600236SS).
- Step 5: Utilize the outputs to make well-informed investment decisions or to create detailed reports.
Why Choose Our Calculator?
- Designed for Experts: A sophisticated tool utilized by analysts, executives, and industry consultants.
- Accurate Data: Historical and projected financials for Guangxi Guiguan Electric Power Co., Ltd. (600236SS) preloaded for reliability.
- Flexible Scenario Analysis: Effortlessly simulate various forecasts and assumptions.
- Comprehensive Outputs: Automatically computes intrinsic value, NPV, and essential financial metrics.
- User-Friendly: Step-by-step guidance to walk you through every aspect of the process.
Who Can Benefit from This Product?
- Energy Sector Students: Explore energy valuation techniques and apply them with real-world data.
- Researchers: Integrate industry-specific models into academic projects or studies.
- Investors: Challenge your investment hypotheses and evaluate valuation metrics for Guangxi Guiguan Electric Power Co., Ltd. (600236SS).
- Financial Analysts: Enhance your analysis process with a tailored, ready-to-use DCF model.
- Small Business Owners: Understand the analytical approaches used for evaluating large public utilities like Guangxi Guiguan Electric Power Co., Ltd. (600236SS).
Contents of the Template
- Historical Data: Provides Guangxi Guiguan Electric Power Co., Ltd.'s (600236SS) previous financials and foundational forecasts.
- DCF and Levered DCF Models: Comprehensive templates for assessing the intrinsic value of Guangxi Guiguan Electric Power Co., Ltd. (600236SS).
- WACC Sheet: Includes pre-built calculations for the Weighted Average Cost of Capital.
- Editable Inputs: Adjust key drivers such as growth rates, EBITDA %, and CAPEX assumptions.
- Quarterly and Annual Statements: Detailed analysis of Guangxi Guiguan Electric Power Co., Ltd.'s (600236SS) financial performance.
- Interactive Dashboard: Dynamically visualize valuation outcomes and forecasts.
Disclaimer
All information, articles, and product details provided on this website are for general informational and educational purposes only. We do not claim any ownership over, nor do we intend to infringe upon, any trademarks, copyrights, logos, brand names, or other intellectual property mentioned or depicted on this site. Such intellectual property remains the property of its respective owners, and any references here are made solely for identification or informational purposes, without implying any affiliation, endorsement, or partnership.
We make no representations or warranties, express or implied, regarding the accuracy, completeness, or suitability of any content or products presented. Nothing on this website should be construed as legal, tax, investment, financial, medical, or other professional advice. In addition, no part of this site—including articles or product references—constitutes a solicitation, recommendation, endorsement, advertisement, or offer to buy or sell any securities, franchises, or other financial instruments, particularly in jurisdictions where such activity would be unlawful.
All content is of a general nature and may not address the specific circumstances of any individual or entity. It is not a substitute for professional advice or services. Any actions you take based on the information provided here are strictly at your own risk. You accept full responsibility for any decisions or outcomes arising from your use of this website and agree to release us from any liability in connection with your use of, or reliance upon, the content or products found herein.