
|
Guodian Nanjing Automation Co., Ltd. (600268.SS) Avaliação DCF |
Totalmente Editável: Adapte-Se Às Suas Necessidades No Excel Ou Planilhas
Design Profissional: Modelos Confiáveis E Padrão Da Indústria
Pré-Construídos Para Uso Rápido E Eficiente
Compatível com MAC/PC, totalmente desbloqueado
Não É Necessária Experiência; Fácil De Seguir
Guodian Nanjing Automation Co., Ltd. (600268.SS) Bundle
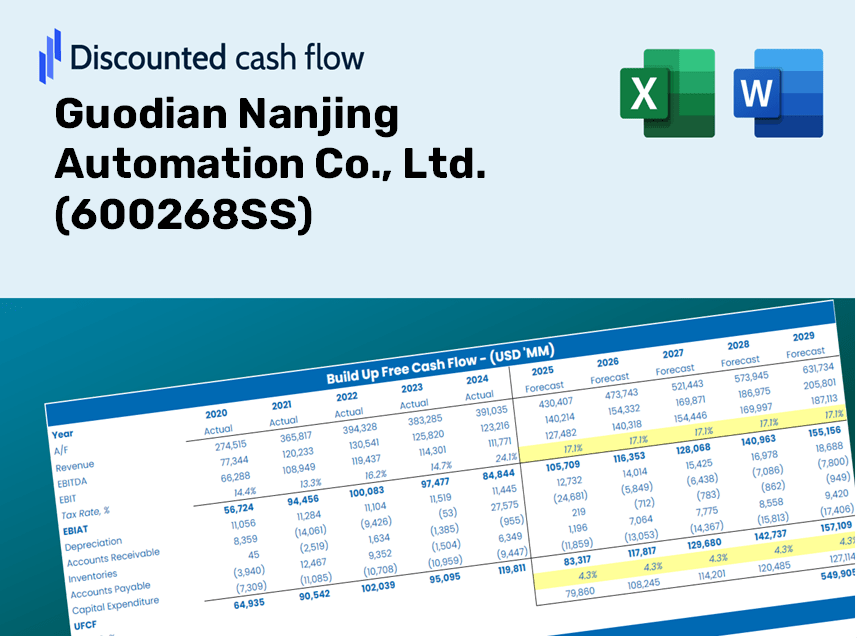
Procurando avaliar o valor intrínseco da Guodian Nanjing Automation Co., Ltd.? Nossa calculadora DCF (600268SS) integra dados do mundo real com extensos recursos de personalização, permitindo refinar suas previsões e aprimorar suas opções de investimento.
Discounted Cash Flow (DCF) - (USD MM)
| Year | AY1 2020 |
AY2 2021 |
AY3 2022 |
AY4 2023 |
AY5 2024 |
FY1 2025 |
FY2 2026 |
FY3 2027 |
FY4 2028 |
FY5 2029 |
|---|---|---|---|---|---|---|---|---|---|---|
| Revenue | 5,032.0 | 5,892.9 | 7,007.8 | 7,623.3 | 9,030.3 | 8,668.7 | 8,321.7 | 7,988.5 | 7,668.7 | 7,361.7 |
| Revenue Growth, % | 0 | 17.11 | 18.92 | 8.78 | 18.46 | -4 | -4 | -4 | -4 | -4 |
| EBITDA | 425.0 | 452.0 | 604.2 | 690.5 | 769.8 | 733.7 | 704.4 | 676.2 | 649.1 | 623.1 |
| EBITDA, % | 8.45 | 7.67 | 8.62 | 9.06 | 8.53 | 8.46 | 8.46 | 8.46 | 8.46 | 8.46 |
| Depreciation | 151.4 | 149.7 | 159.4 | 193.2 | 128.0 | 204.1 | 196.0 | 188.1 | 180.6 | 173.4 |
| Depreciation, % | 3.01 | 2.54 | 2.27 | 2.53 | 1.42 | 2.36 | 2.36 | 2.36 | 2.36 | 2.36 |
| EBIT | 273.6 | 302.3 | 444.8 | 497.3 | 641.8 | 529.6 | 508.4 | 488.0 | 468.5 | 449.7 |
| EBIT, % | 5.44 | 5.13 | 6.35 | 6.52 | 7.11 | 6.11 | 6.11 | 6.11 | 6.11 | 6.11 |
| Total Cash | 1,305.1 | 1,776.7 | 1,213.9 | 1,814.0 | 2,653.3 | 2,194.7 | 2,106.8 | 2,022.5 | 1,941.5 | 1,863.8 |
| Total Cash, percent | .0 | .0 | .0 | .0 | .0 | .0 | .0 | .0 | .0 | .0 |
| Account Receivables | 3,899.5 | 3,809.9 | 4,105.9 | 4,186.1 | 4,920.9 | 5,377.1 | 5,161.8 | 4,955.2 | 4,756.8 | 4,566.3 |
| Account Receivables, % | 77.49 | 64.65 | 58.59 | 54.91 | 54.49 | 62.03 | 62.03 | 62.03 | 62.03 | 62.03 |
| Inventories | 828.3 | 937.9 | 1,114.8 | 1,138.0 | 1,132.0 | 1,313.3 | 1,260.7 | 1,210.2 | 1,161.8 | 1,115.3 |
| Inventories, % | 16.46 | 15.92 | 15.91 | 14.93 | 12.54 | 15.15 | 15.15 | 15.15 | 15.15 | 15.15 |
| Accounts Payable | 3,672.9 | 3,792.6 | 3,696.0 | 4,060.3 | 4,524.2 | 5,087.7 | 4,884.0 | 4,688.5 | 4,500.8 | 4,320.6 |
| Accounts Payable, % | 72.99 | 64.36 | 52.74 | 53.26 | 50.1 | 58.69 | 58.69 | 58.69 | 58.69 | 58.69 |
| Capital Expenditure | -58.8 | -41.3 | -52.2 | -60.9 | -57.6 | -70.2 | -67.4 | -64.7 | -62.1 | -59.6 |
| Capital Expenditure, % | -1.17 | -0.70065 | -0.74479 | -0.79854 | -0.63814 | -0.81023 | -0.81023 | -0.81023 | -0.81023 | -0.81023 |
| Tax Rate, % | 49.18 | 49.18 | 49.18 | 49.18 | 49.18 | 49.18 | 49.18 | 49.18 | 49.18 | 49.18 |
| EBITAT | 66.5 | 161.3 | 157.6 | 231.8 | 326.2 | 223.0 | 214.0 | 205.5 | 197.3 | 189.4 |
| Depreciation | ||||||||||
| Changes in Account Receivables | ||||||||||
| Changes in Inventories | ||||||||||
| Changes in Accounts Payable | ||||||||||
| Capital Expenditure | ||||||||||
| UFCF | -895.8 | 369.5 | -304.8 | 625.0 | 131.8 | 282.9 | 406.8 | 390.5 | 374.8 | 359.8 |
| WACC, % | 6.58 | 6.63 | 6.6 | 6.62 | 6.63 | 6.61 | 6.61 | 6.61 | 6.61 | 6.61 |
| PV UFCF | ||||||||||
| SUM PV UFCF | 1,496.8 | |||||||||
| Long Term Growth Rate, % | 3.50 | |||||||||
| Free cash flow (T + 1) | 372 | |||||||||
| Terminal Value | 11,968 | |||||||||
| Present Terminal Value | 8,689 | |||||||||
| Enterprise Value | 10,186 | |||||||||
| Net Debt | -2,366 | |||||||||
| Equity Value | 12,552 | |||||||||
| Diluted Shares Outstanding, MM | 1,002 | |||||||||
| Equity Value Per Share | 12.53 |
Your Benefits
- Authentic 600268SS Financial Data: Access both historical and projected figures for precise valuation.
- Customizable Parameters: Adjust WACC, tax rates, revenue growth, and capital expenditures as needed.
- Real-Time Calculations: Intrinsic value and NPV calculations update automatically.
- Comprehensive Scenario Analysis: Explore various scenarios to assess the future performance of Guodian Nanjing Automation Co., Ltd.
- User-Friendly and Professional Design: Crafted for experts while remaining approachable for newcomers.
Key Features
- Comprehensive DCF Calculator: Offers detailed unlevered and levered DCF valuation frameworks.
- WACC Calculator: Pre-configured Weighted Average Cost of Capital tool with adjustable inputs.
- Customizable Forecast Parameters: Adjust growth projections, capital expenditures, and discount rates.
- Integrated Financial Ratios: Evaluate profitability, leverage, and efficiency ratios for Guodian Nanjing Automation Co., Ltd. (600268SS).
- Interactive Dashboard and Charts: Visual representations summarize essential valuation metrics for straightforward analysis.
How It Works
- Step 1: Download the Excel file.
- Step 2: Review the pre-filled Guodian Nanjing Automation data (historical and projected).
- Step 3: Modify key assumptions (highlighted in yellow) based on your analysis.
- Step 4: Observe automatic updates for Guodian Nanjing Automation's intrinsic value.
- Step 5: Utilize the results for investment strategies or reporting purposes.
Why Choose the Guodian Nanjing Automation Co., Ltd. (600268SS) Calculator?
- Precision: Based on accurate financial data from Guodian Nanjing Automation.
- Adaptability: Tailored for users to easily modify and experiment with inputs.
- Efficiency: Eliminate the challenges of creating a DCF model from the ground up.
- High-Caliber: Crafted with the precision and functionality expected at the CFO level.
- Intuitive: Straightforward to operate, suitable for users without extensive financial modeling skills.
Who Can Benefit from Guodian Nanjing Automation Co., Ltd. (600268SS)?
- Investors: Enhance your investment strategies with reliable insights into the automation sector.
- Financial Analysts: Streamline your analyses with ready-to-use financial models tailored for automation companies.
- Consultants: Quickly modify templates for impactful client presentations and comprehensive reports.
- Technology Enthusiasts: Expand your knowledge of automation technologies and their market applications.
- Educators and Students: Utilize it as a dynamic resource for learning about finance and engineering in automation.
What the Template Includes
- Preloaded 600268SS Data: Historical and projected financial metrics, encompassing revenue, EBIT, and capital expenditures.
- DCF and WACC Models: Advanced spreadsheets for determining intrinsic value and Weighted Average Cost of Capital.
- Editable Inputs: Cells highlighted in yellow for modifying revenue growth, tax rates, and discount rates.
- Financial Statements: Detailed annual and quarterly financial reports for in-depth analysis.
- Key Ratios: Metrics on profitability, leverage, and efficiency for performance evaluation.
- Dashboard and Charts: Visual representations of valuation results and underlying assumptions.
Disclaimer
All information, articles, and product details provided on this website are for general informational and educational purposes only. We do not claim any ownership over, nor do we intend to infringe upon, any trademarks, copyrights, logos, brand names, or other intellectual property mentioned or depicted on this site. Such intellectual property remains the property of its respective owners, and any references here are made solely for identification or informational purposes, without implying any affiliation, endorsement, or partnership.
We make no representations or warranties, express or implied, regarding the accuracy, completeness, or suitability of any content or products presented. Nothing on this website should be construed as legal, tax, investment, financial, medical, or other professional advice. In addition, no part of this site—including articles or product references—constitutes a solicitation, recommendation, endorsement, advertisement, or offer to buy or sell any securities, franchises, or other financial instruments, particularly in jurisdictions where such activity would be unlawful.
All content is of a general nature and may not address the specific circumstances of any individual or entity. It is not a substitute for professional advice or services. Any actions you take based on the information provided here are strictly at your own risk. You accept full responsibility for any decisions or outcomes arising from your use of this website and agree to release us from any liability in connection with your use of, or reliance upon, the content or products found herein.