
|
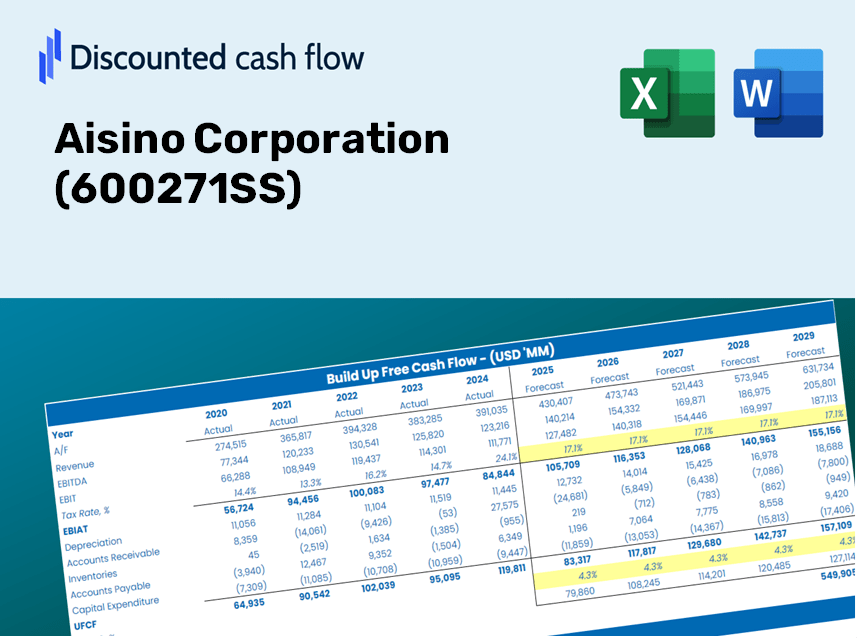
Avaliação DCF da Corporação Aisino (600271.SS) |
Totalmente Editável: Adapte-Se Às Suas Necessidades No Excel Ou Planilhas
Design Profissional: Modelos Confiáveis E Padrão Da Indústria
Pré-Construídos Para Uso Rápido E Eficiente
Compatível com MAC/PC, totalmente desbloqueado
Não É Necessária Experiência; Fácil De Seguir
Aisino Corporation (600271.SS) Bundle
Como investidor ou analista, a calculadora DCF da Aisino Corporation (600271SS) é o seu recurso preferido para uma avaliação precisa. Pré -carregado com dados reais da Aisino Corporation, você pode ajustar as previsões e observar imediatamente os efeitos.
What You Will Receive
- Authentic Aisino Corporation (600271SS) Financials: Offers historical and projected data for precise valuation.
- Customizable Inputs: Adjust WACC, tax rates, revenue growth, and capital expenditures according to your needs.
- Automated Calculations: Obtain intrinsic value and NPV with real-time calculations.
- Scenario Analysis: Evaluate various scenarios to assess Aisino's future performance.
- User-Friendly Design: Crafted for professionals while remaining accessible to newcomers.
Key Features
- Advanced DCF Calculator: Offers comprehensive unlevered and levered DCF valuation models tailored for Aisino Corporation (600271SS).
- WACC Calculator: Features a pre-built Weighted Average Cost of Capital sheet with adjustable input parameters for Aisino Corporation (600271SS).
- Customizable Forecast Assumptions: Adjust growth rates, capital expenditures, and discount rates specifically for Aisino Corporation (600271SS).
- Integrated Financial Ratios: Evaluate profitability, leverage, and efficiency ratios relevant to Aisino Corporation (600271SS).
- Dashboard and Charts: Visual representations summarize essential valuation metrics, facilitating straightforward analysis for Aisino Corporation (600271SS).
How It Functions
- Download the Template: Gain immediate access to the Excel-based Aisino Corporation (600271SS) DCF Calculator.
- Input Your Assumptions: Modify the yellow-highlighted cells for parameters such as growth rates, WACC, margins, and more.
- Instant Calculations: The model automatically recalculates Aisino’s intrinsic value.
- Test Scenarios: Explore various assumptions to assess potential changes in valuation.
- Analyze and Decide: Leverage the results to inform your investment or financial evaluation.
Why Opt for This Calculator?
- All-in-One Solution: Combines DCF, WACC, and financial ratio analyses for comprehensive evaluations.
- Flexible Inputs: Modify the yellow-highlighted cells to explore different scenarios.
- In-Depth Analysis: Automatically computes Aisino Corporation’s intrinsic value and Net Present Value.
- Preloaded Information: Access historical and projected data for reliable baselines.
- High-Caliber Tool: Perfect for financial analysts, investors, and business consultants alike.
Who Should Utilize Aisino Corporation's Products?
- Professional Investors: Create comprehensive and trustworthy valuation models for portfolio management.
- Corporate Finance Teams: Evaluate valuation scenarios to inform strategic decisions within the company.
- Consultants and Advisors: Deliver precise valuation insights to clients regarding Aisino Corporation (600271SS).
- Students and Educators: Apply real-world data to enhance skills in financial modeling and teaching.
- Tech Enthusiasts: Gain insight into the valuation processes of technology firms like Aisino Corporation (600271SS) in the marketplace.
Contents of the Template
- Preloaded Aisino Corporation Data: Historical and projected financial figures, including revenue, EBIT, and capital expenditures.
- DCF and WACC Models: Professional-grade spreadsheets for determining intrinsic value and Weighted Average Cost of Capital.
- Editable Inputs: Yellow-highlighted cells that allow adjustments to revenue growth, tax rates, and discount rates.
- Financial Statements: Detailed annual and quarterly financial reports for in-depth analysis.
- Key Ratios: Metrics for profitability, leverage, and efficiency to assess performance.
- Dashboard and Charts: Visual representations of valuation results and underlying assumptions.
Disclaimer
All information, articles, and product details provided on this website are for general informational and educational purposes only. We do not claim any ownership over, nor do we intend to infringe upon, any trademarks, copyrights, logos, brand names, or other intellectual property mentioned or depicted on this site. Such intellectual property remains the property of its respective owners, and any references here are made solely for identification or informational purposes, without implying any affiliation, endorsement, or partnership.
We make no representations or warranties, express or implied, regarding the accuracy, completeness, or suitability of any content or products presented. Nothing on this website should be construed as legal, tax, investment, financial, medical, or other professional advice. In addition, no part of this site—including articles or product references—constitutes a solicitation, recommendation, endorsement, advertisement, or offer to buy or sell any securities, franchises, or other financial instruments, particularly in jurisdictions where such activity would be unlawful.
All content is of a general nature and may not address the specific circumstances of any individual or entity. It is not a substitute for professional advice or services. Any actions you take based on the information provided here are strictly at your own risk. You accept full responsibility for any decisions or outcomes arising from your use of this website and agree to release us from any liability in connection with your use of, or reliance upon, the content or products found herein.